
Hello! Welcome to the next step in your Power BI journey.
In our last lesson, we focused on getting data into Power BI. We explored how to connect to various sources like Excel files and web pages and saw the Navigator window, which gives you two choices: Load or Transform Data. We've been holding off on that second option, but today, we're diving in.
This lesson is all about the Power Query Editor, the engine room of Power BI. Our goal is to learn how to use it to perform basic data transformation and cleaning tasks. You'll often hear the phrase "Garbage In, Garbage Out" in data analysis. This lesson is about making sure you start with clean, well-structured data, so the financial visualizations you create are accurate and trustworthy.
1. Welcome to the Power Query Editor
When you click "Transform Data" after connecting to a data source, you don't load the data into the main Power BI report view. Instead, you open a separate window: the Power Query Editor. Think of it as a data preparation workshop where you can shape, clean, and standardize your data before it's ready for analysis.
This dedicated environment is incredibly powerful because the changes you make are non-destructive and repeatable. Let's get familiar with its layout.
Power BI Tutorial for Beginners
This article from DataCamp provides an excellent overview of the Power Query Editor's interface. It will help you get oriented before we start transforming data.
Please read the section titled 'Power Query'. Focus on its description of the four main parts: the Ribbon, Queries pane, Data view, and especially the 'Transformation steps' pane.
The "Applied Steps" Pane: Your Safety Net
The most important concept to grasp in Power Query is the Applied Steps pane. Every single action you take—removing a column, changing a data type, replacing a value—is recorded as a step in a list.
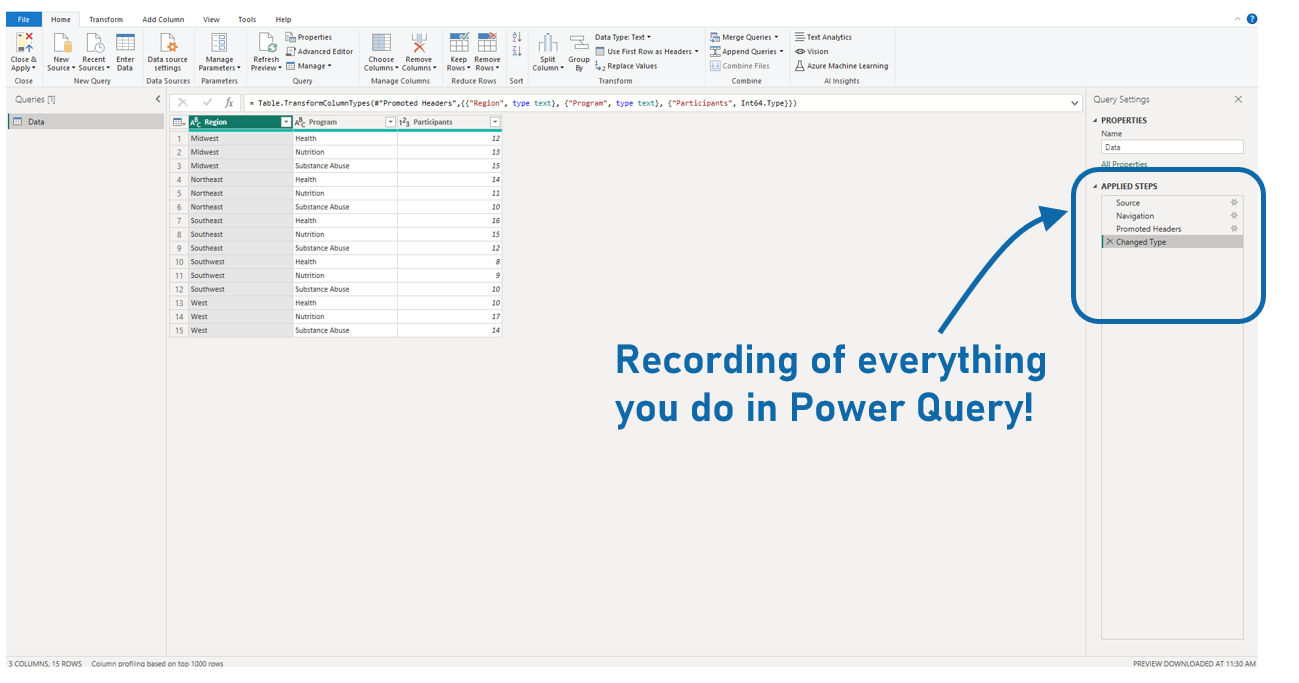
This is a massive advantage over cleaning data in Excel, where undoing a change made ten steps ago is often impossible. Here, you have a complete, editable history of your work.
2. Essential Data Cleaning and Transformation Tasks
Now, let's get hands-on. We'll walk through the most common transformations you'll need when working with financial data. The best way to learn these is by seeing them in action.
Power BI Tutorial For Beginners | Create Your First Dashboard Now (Practice Files included)
To start, let's watch this excellent video from Leila Gharani. It covers several of the most fundamental data transformation tasks in a clear, practical way. We will refer back to different parts of this video as we cover each task.
Watch the beginning of the video from 02:05 to 03:14. This part will recap how to open the Power Query Editor and will introduce the first transformations that Power BI often applies automatically.
A. Checking and Changing Data Types
Power BI does a good job of guessing data types, but it's not always perfect. A column of stock prices read as Text instead of Decimal Number will cause errors in your charts and calculations. This is always the first thing you should check.
You can identify a column's data type by the icon in its header (e.g., ABC for text, 123 for whole number, 1.2 for decimal, a calendar for date).
Power BI Tutorial For Beginners | Create Your First Dashboard Now (Practice Files included)
Let's continue with the 'Power BI Tutorial For Beginners' video to see how to check and change data types. Notice the financial relevance of changing a number to a 'Currency' type.
Watch from 03:14 to 04:07. Pay close attention to how she clicks the icon in the column header to change the 'Sales' column's data type to Currency. This is a vital step for any financial data.
B. Structuring and Reshaping Your Data
Financial datasets often need some structural work before they are useful. This can involve removing irrelevant information or combining/splitting columns to get them into the right format.
1. Removing Unnecessary Columns
Your source data might contain columns you don't need for your analysis (e.g., internal notes, irrelevant IDs). Removing them makes your data model cleaner and more efficient.
Ultimate Power Bi Data Transformation/Cleansing Guide (Power Query)🔧📊
This video from The Power BI Guy demonstrates two ways to remove columns: selecting the ones you want to delete, or selecting the ones you want to keep.
Watch from 02:12 to 03:52. The 'Choose Columns' feature shown is particularly useful when you have a wide table with many columns.
2. Splitting and Merging Columns
This is a very common requirement.
- Splitting: You might have a column like "City, Country" that you want to split into two separate columns for mapping.
- Merging: You might get separate "Year", "Month", and "Day" columns that you need to combine into a single
Datecolumn for time-series analysis.
Power BI Tutorial For Beginners | Create Your First Dashboard Now (Practice Files included)
Let's return to Leila Gharani's video, which shows perfect examples of both merging and splitting.
Watch from 04:07 to 06:49. First, see how she merges three columns to create a proper 'Date' column—a critical skill for financial data. Then, observe how she splits the 'City Province' column using a delimiter.
C. Cleaning Data at the Cell Level
Once the structure is right, you need to look at the values themselves. Typos, extra characters, blank values, and duplicates can all invalidate your analysis.
1. Replacing Values and Removing Blank Rows
Imagine a stock price column where some values are entered as "N/A" or are simply blank. You can't perform calculations on this. You need to either replace these with a number (like 0) or remove the rows entirely.

Ultimate Power Bi Data Transformation/Cleansing Guide (Power Query)🔧📊
The Power BI Guy's video has a great segment on finding and replacing blank values, a crucial data quality step.
Watch from 03:52 to 04:47. He demonstrates how to replace blank values in a column with a specific text like 'Not Identified'. For numerical financial data, you might replace blanks with 0.
2. Removing Duplicates
If you have a table of company information, you want to ensure each company appears only once. The "Remove Duplicates" feature is perfect for this.
Ultimate Power Bi Data Transformation/Cleansing Guide (Power Query)🔧📊
Let's watch one more clip from The Power BI Guy that shows how to remove duplicate values. This is essential for creating clean reference tables (e.g., a unique list of stock tickers).
Watch from 06:11 to 07:09. See how a right-click on the column header gives you the option to quickly remove all duplicate entries.
Test your understanding!
You import a CSV file of daily stock data for Reliance Industries Ltd. (RELIANCE.NS) and notice a few problems in the Power Query Editor:
- The
Datecolumn is formatted as text (ABC). - The
Volumecolumn, representing shares traded, is correct, but theAdj Closeprice column is also formatted as text because some values have a rupee symbol (₹) in front of them. - There is a
Notescolumn that is completely empty and you don't need it.
What three basic transformation steps would you perform in order to clean this data for analysis?
Show answer
- Change Data Type: Select the
Datecolumn and change its data type from Text to Date. - Replace Values & Change Type: Select the
Adj Closecolumn. First, use Replace Values to find the₹symbol and replace it with nothing (leave the 'Replace With' box empty). Then, change the column's data type to Decimal Number. - Remove Columns: Right-click the header of the
Notescolumn and select Remove.
3. Applying Your Work
Once you're satisfied with your data transformations, you need to load the clean data into your Power BI model. You do this by clicking the Close & Apply button on the Home ribbon of the Power Query Editor.
This closes the editor and applies all the steps you defined to the data as it's loaded into the main Power BI window. The best part? These steps are saved with your report. The next time you refresh your data, Power BI will automatically perform all those cleaning steps for you.
Power BI Tutorial For Beginners | Create Your First Dashboard Now (Practice Files included)
Finally, let's see how to apply these changes and how to get back to the Power Query Editor if you realize you missed something.
Watch from 08:24 to 10:04. This clip shows the 'Close & Apply' step and, importantly, how to right-click a table in the main Power BI interface and select 'Edit Query' to return to the Power Query Editor.
Conclusion
Fantastic work! You've just learned one of the most critical and powerful features of Power BI. Mastering the Power Query Editor is the key to creating reliable and accurate financial reports. Clean data is the bedrock of trustworthy analysis.
Key Takeaways:
- The Power Query Editor is a dedicated environment for cleaning, shaping, and transforming your data before it's loaded for visualization.
- Every action is recorded in the Applied Steps pane, creating a repeatable and editable recipe for your data cleaning process.
- Fundamental transformations include:
- Changing data types (e.g., text to date, text to currency).
- Removing unnecessary columns.
- Splitting or merging columns to get the right structure.
- Replacing incorrect values and handling blanks.
- Removing duplicates to create clean lists.
- Clicking Close & Apply loads your cleaned data into the model and saves your transformation steps for future refreshes.
In this lesson and the last, we've learned how to import data from multiple sources and clean each table individually. But what if you have a table of stock transactions and a separate table with company details? How do you link them? In our next lesson, we will explore the relationship model in Power BI and learn how to create simple relationships between your data tables, unlocking much deeper analytical possibilities.
Can't find a good explanation? Sign up and we'll make it for you
Sign up