
Hello! Welcome to the third lesson in our module on AC circuits.
In our last lesson, we established the distinct behaviors of resistors, inductors, and capacitors in an AC circuit. We saw that while resistors keep voltage and current in lockstep, inductors and capacitors introduce a 90° phase shift, with voltage leading current in inductors (ELI) and current leading voltage in capacitors (ICE).
Today, we'll build on that foundation to achieve this lesson's learning outcome: to analyze the phase relationship between voltage and current in resistive, inductive, and capacitive loads. We'll move from individual components to combined loads (like RL, RC, and RLC circuits) and see how their individual phase shifts combine to produce an overall phase relationship for the entire circuit. To do this, we'll introduce a powerful graphical tool: the phasor diagram.
A Quick Recap and the Challenge Ahead
Let's quickly summarize what we know for series circuits:
- Resistor: Voltage across it, , is in phase with the current .
- Inductor: Voltage across it, , leads the current by 90°.
- Capacitor: Voltage across it, , lags the current by 90°.
The challenge is this: if we connect these components in series, the total voltage from the source, , is the sum of the individual voltages: . However, because these voltages are not in phase, we cannot simply add their magnitudes. We need a way to account for their different directions in time.
Phasors: A Graphical Tool for AC Analysis
This is where phasors come in. A phasor is a vector that rotates counter-clockwise in the complex plane. Its length represents the amplitude (peak or RMS value) of a sinusoidal wave, and its angle relative to the positive real axis represents its phase. The instantaneous value of the wave is the projection of this rotating vector onto the vertical or horizontal axis.
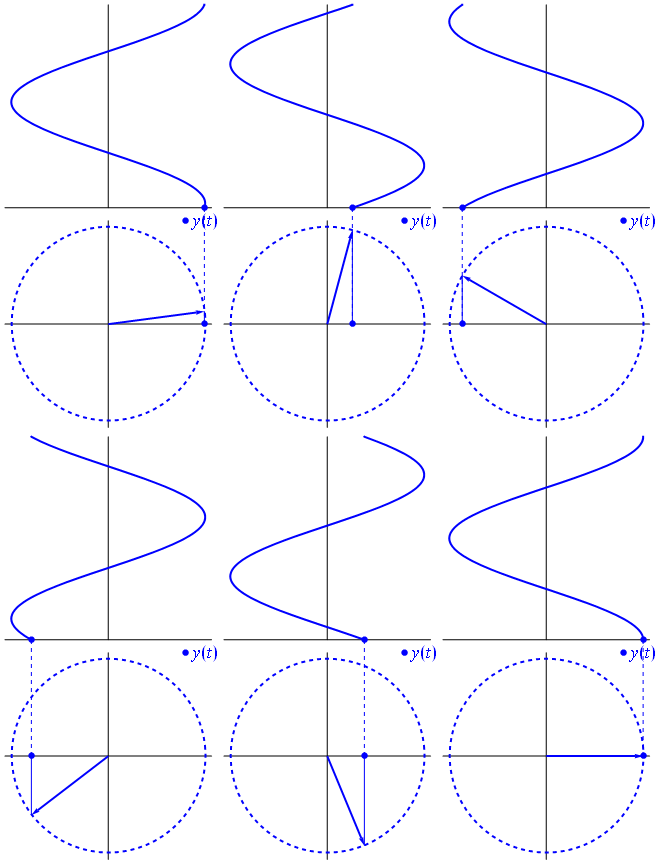
A phasor is a rotating vector. Its projection on an axis gives the instantaneous value of a sinusoidal quantity. Its length represents the amplitude and its angle represents the phase.
Your background in linear algebra will make this concept feel natural. We are essentially treating sinusoidal quantities as vectors in a 2D space. This turns the problem of solving the circuit's differential equation into a more straightforward problem of vector addition.
Building the Phasor Diagram for a Series RLC Circuit
In a series circuit, the current is the same through all components. This makes it the ideal reference for our phasor diagram. We'll place the current phasor along the positive horizontal axis. Then, we add the voltage phasors for each component, respecting their phase relationships to the current.
This process is best understood by seeing it built step-by-step.
AC Circuits : Series RLC Circuit | Electrical Engineering | TheElectricalGuy
This video by Gaurav J - TheElectricalGuy provides an excellent, clear walkthrough of how to construct the phasor diagram for a series RLC circuit.
Please watch the segment from 06:34 to 09:24. Focus on how the diagram is built: starting with the current phasor as a reference, then adding the voltage phasors for the resistor (VR), inductor (VL), and capacitor (VC) according to their individual phase relationships.
As you saw in the video, the key steps are:
- Draw the current phasor as the horizontal reference.
- Draw the resistor voltage phasor in phase (parallel) with .
- Draw the inductor voltage phasor leading by 90° (pointing straight up).
- Draw the capacitor voltage phasor lagging by 90° (pointing straight down).
Since and are in direct opposition (180° out of phase), their net effect is a simple subtraction: . The total source voltage is then the vector sum of and this net reactive voltage .
This vector addition forms a right-angled triangle, often called the voltage triangle.
The website Electronics Tutorials provides excellent static diagrams that summarize this process and introduce the voltage triangle.
Read from the 'Individual Voltage Vectors' section down to the end of the 'Voltage Triangle for a Series RLC Circuit' section. This will reinforce what you saw in the video and show how Pythagoras's theorem applies to the resulting voltage triangle.
The geometry of the voltage triangle is the key to analyzing the overall phase relationship. The angle between the total voltage phasor and the current phasor is the phase angle of the entire circuit.
Interpreting the Overall Phase Relationship
The overall behavior of the RLC circuit—whether it acts more like an inductor or a capacitor—depends on which of the two reactances is dominant at the given frequency.
AC Circuits : Series RLC Circuit | Electrical Engineering | TheElectricalGuy
Let's return to the video, which now explains the three possible scenarios based on the relative strengths of the inductive and capacitive reactances.
Watch from 11:22 to 13:38. Pay attention to how the circuit behaves when XL > XC, XC > XL, and XL = XC.
To summarize the three cases:
- If : The inductive reactance is dominant. This means . The net reactive voltage is positive (points up). The total voltage leads the current . The circuit has an inductive character.
- If : The capacitive reactance is dominant. This means . The net reactive voltage is negative (points down). The total voltage lags the current . The circuit has a capacitive character.
- If : The reactances cancel each other out completely. The net reactive voltage is zero. The total voltage is in phase with the current . The circuit behaves as if it were purely resistive. This special condition is called resonance.
Test your understanding!
You have a series RLC circuit connected to an AC source with a variable frequency. Initially, the frequency is very low. You slowly increase the frequency. How does the phase angle between the source voltage and current change?
Hint: Consider how and depend on frequency.
Show answer
- At very low frequencies: is very large, and is very small. Therefore, . The circuit is strongly capacitive, and the voltage lags the current by an angle close to -90°.
- As frequency increases: decreases and increases. The circuit becomes less capacitive, and the phase angle moves from near -90° up towards 0°.
- At the resonant frequency (): . The phase angle is 0°. Voltage and current are in phase.
- As frequency increases further: becomes larger than . The circuit becomes inductive, and the phase angle becomes positive, moving from 0° up towards +90°.
- At very high frequencies: . The circuit is strongly inductive, and the voltage leads the current by an angle close to +90°.
Quantifying the Phase Angle
From the geometry of the voltage triangle, we can define the phase angle using basic trigonometry:
Since , , and , we can substitute these in and cancel the common current :
This gives us a direct way to calculate the phase angle from the resistance and reactances:
A positive angle indicates an inductive circuit (voltage leads current), while a negative angle indicates a capacitive circuit (voltage lags current).
A Complete Example
Let's walk through a concrete example to see how these concepts are applied to analyze a circuit.
The 'Series RLC Circuit Example No1' from Electronics Tutorials provides a complete, step-by-step calculation for a specific circuit.
Please read through the worked example provided in the 'Series RLC Circuit Example No1' section. Follow the calculations for inductive reactance (XL), capacitive reactance (XC), total circuit impedance (Z), current (I), and finally, the power factor and phase angle (θ). Note how the final phasor diagram visually represents the calculated result.
In this example, since , the final phase angle is positive (), confirming the circuit is inductive, and the current lags the source voltage. The phasor diagram drawn at the end provides a perfect visual summary of this result.
Conclusion
Today, we've developed a powerful method for analyzing AC circuits. By representing sinusoidal voltages and currents as phasors, we can use simple vector addition to understand their combined effect.
Key Takeaways:
- Phasors are rotating vectors that allow us to represent the magnitude and phase of AC quantities.
- In a series circuit, the total voltage is the phasor sum of the individual component voltages.
- The voltage triangle is a geometric representation of the relationship between resistive voltage (), net reactive voltage (), and total source voltage ().
- The overall phase relationship is determined by the balance between inductive reactance () and capacitive reactance (). The circuit behaves inductively if , capacitively if , and resistively if .
- The phase angle can be calculated using .
Preview of the Next Lesson:
The phasor diagram is an excellent visualization tool, but it can be cumbersome for complex calculations. In the next lesson, we will formalize this vector approach by using complex numbers to represent impedance. This will allow us to calculate the total impedance of series RLC circuits using simple arithmetic, providing a more powerful and efficient analytical technique. This directly parallels how you might use complex numbers in other areas of mathematics and physics to handle both magnitude and phase simultaneously.
Can't find a good explanation? Sign up and we'll make it for you
Sign up