Introduction
In our last lesson, you successfully containerized your inference service and learned how to define its deployment on a Kubernetes cluster. This was a critical step in transforming your local application into a portable, production-ready artifact. You now have a service that can be run consistently anywhere, from your local machine to a cloud environment.
However, a deployable service isn't necessarily a production-ready one. How do we know if it can handle the demands of real users? How do we define what "good performance" even means? This lesson answers those questions. Your learning outcome is to load-test the deployed service at high concurrency, measuring performance against defined SLA targets for TTFT and throughput.
We will move from simply running the service to systematically stressing it, measuring its breaking points, and evaluating its performance against the kind of concrete business objectives you would encounter as an AI Systems Engineer.
Part 1: Defining "Good" Performance — Metrics and SLAs
Before we can test our service, we must define what we are measuring and what success looks like. For LLM inference, performance is multi-faceted.
Let's quickly review the key latency components with a helpful visual.
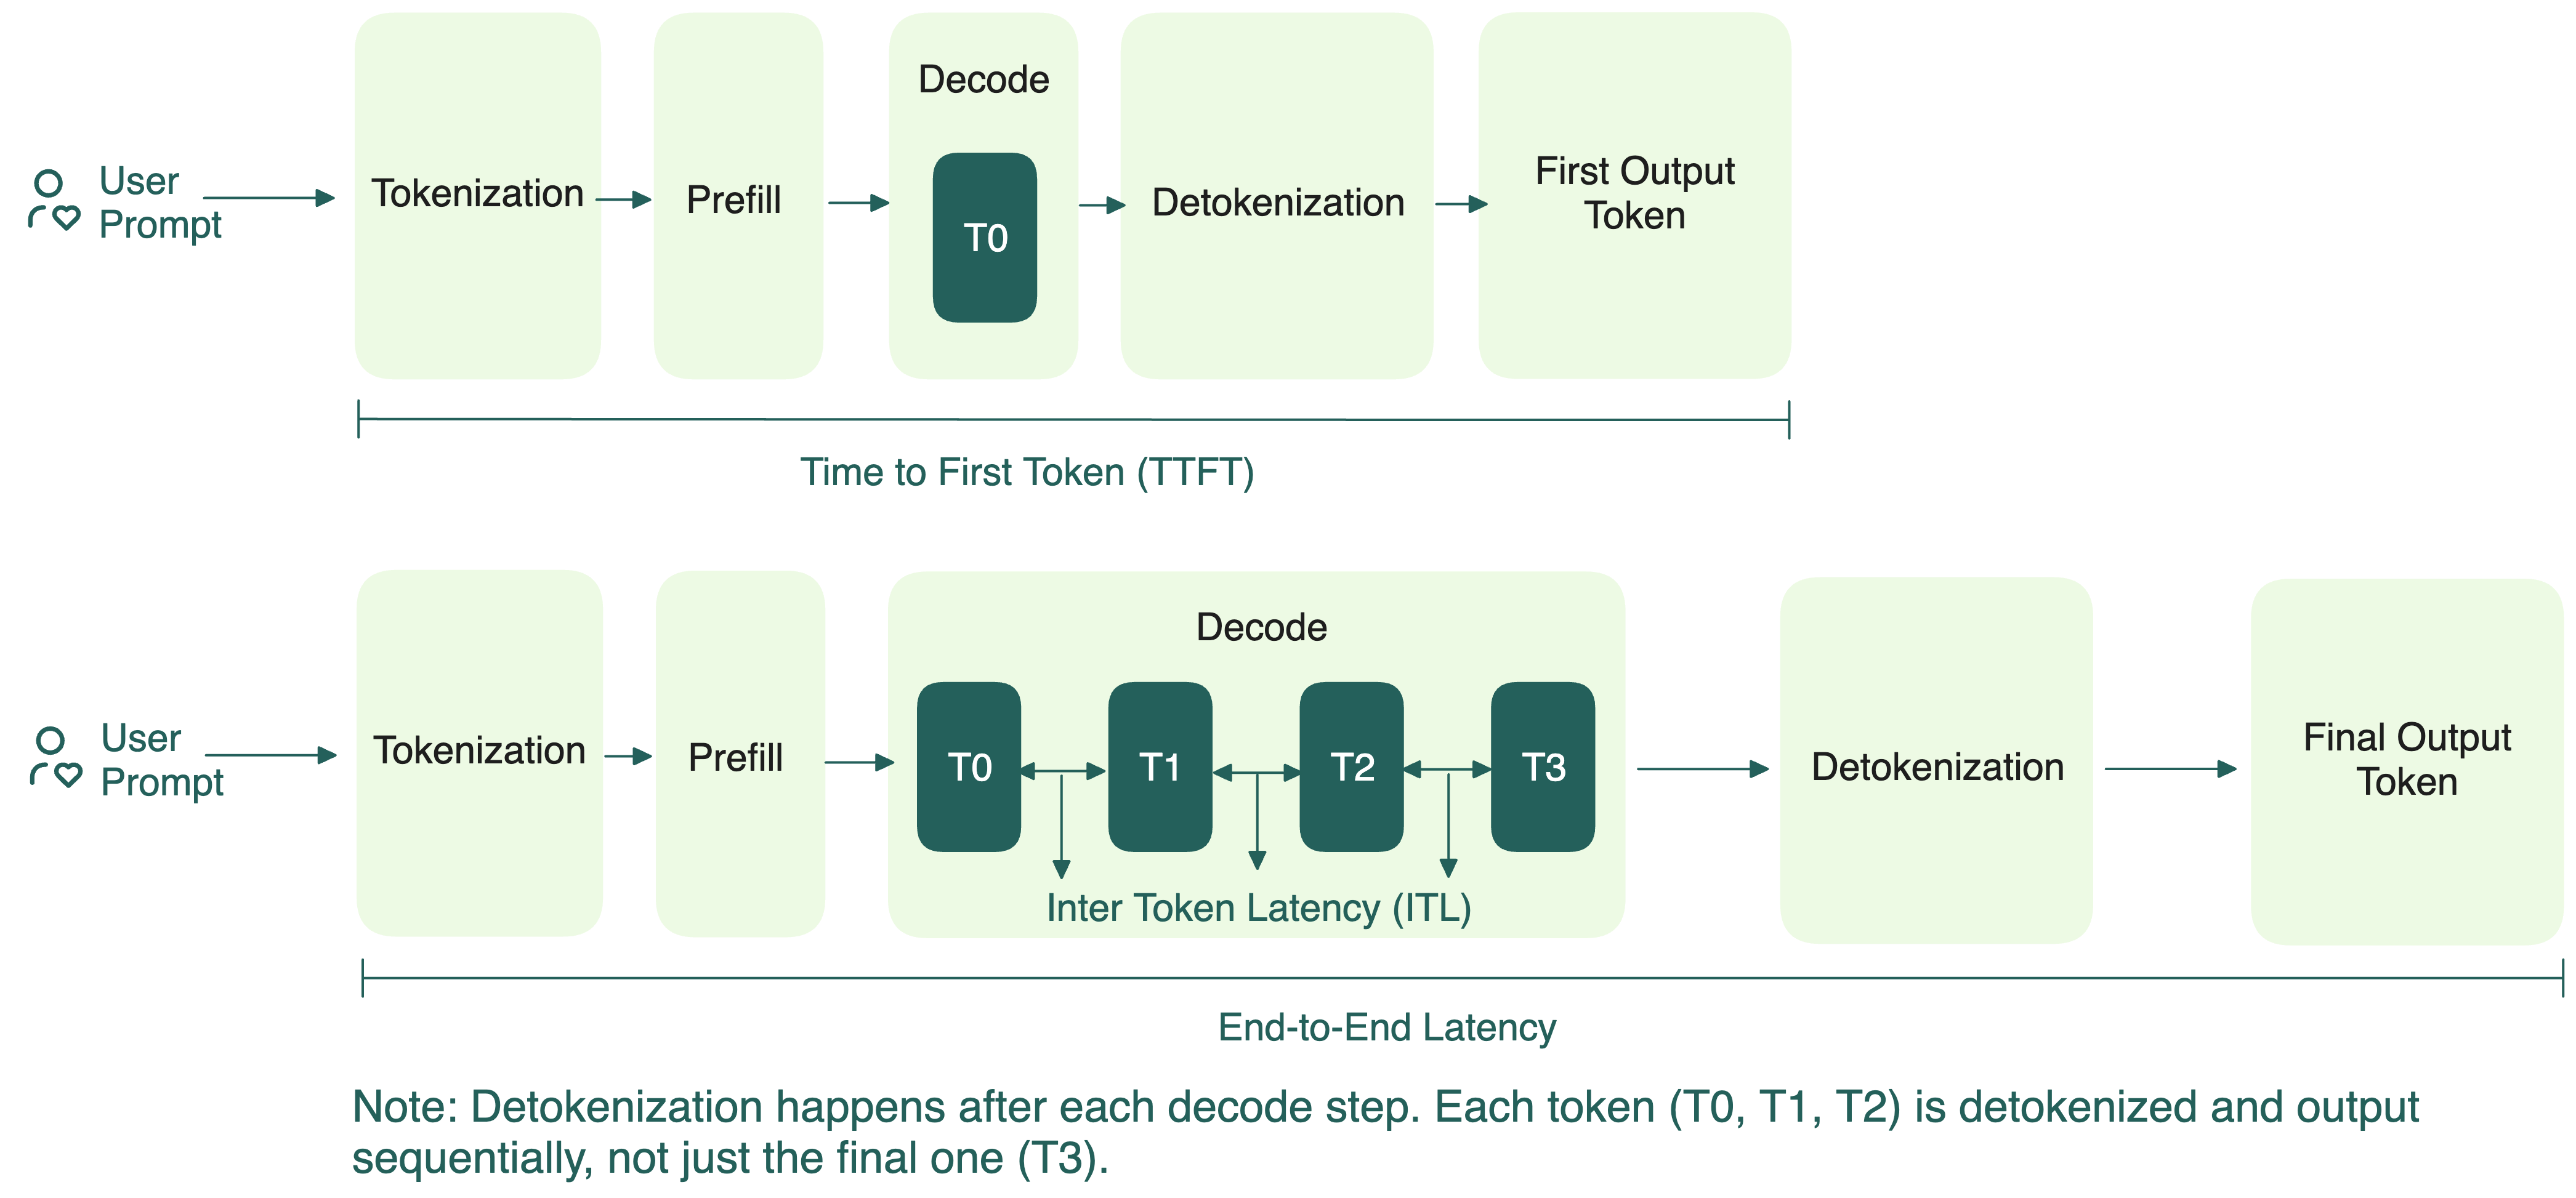
These visual concepts translate into a set of core metrics that are standard across the industry for evaluating LLM inference performance.
LLM Inference Performance Benchmarking from Scratch
The article 'LLM Inference Performance Benchmarking from Scratch' provides exceptionally clear definitions of these core metrics. Understanding them precisely is the foundation of effective benchmarking.
Please read the 'Performance analysis' section. Focus on the definitions for TTFT, Request Latency, Inter-Token Latency (ITL), and the two throughput metrics (per-request TPS and overall TPS). These are the fundamental quantities we will be working with.
To summarize the key metrics:
- Time to First Token (TTFT): The most critical metric for user-perceived responsiveness in interactive applications. A low TTFT makes an application feel fast.
- Inter-Token Latency (ITL) or Time Per Output Token (TPOT): The time between subsequent tokens. This determines the "streaming" speed of the response.
- Output Token Throughput (TPS): The total number of output tokens generated by the system per second. This is a primary measure of a system's overall capacity.
- Request Throughput (RPS): The total number of requests the system can complete per second. This is crucial for understanding how the system handles high user traffic.
With these metrics defined, we can establish Service Level Agreements (SLAs) and Service Level Objectives (SLOs). An SLA is a formal contract with users (e.g., "99% of requests will have a TTFT under 1 second"), while an SLO is the internal target you set to meet that contract.
Metrics That Matter for LLM Inference
The article 'Metrics That Matter for LLM Inference' offers a concise guide on setting these objectives.
Read the section 'Alerting & SLOs'. Note the concrete examples, such as 'TTFT p95 > 1,000 ms for 5 minutes'. This shows how metrics are translated into actionable operational targets.
For this lesson, let's define a hypothetical SLO for our service:
- TTFT p95 ≤ 800ms (95% of requests should see the first token in under 800ms).
- System Throughput ≥ 1000 tokens/sec at a concurrency of 50 users.
Now, we have a clear goal: to test if our service can meet these targets.
Part 2: The Toolkit for LLM Load Testing
Given your background, you've likely used general-purpose load testing tools like ApacheBench (ab), wrk, or JMeter. While powerful, they often fall short for LLMs because they are not designed to handle streaming responses (like Server-Sent Events) or to calculate token-level metrics.
We need a tool that is purpose-built for the unique characteristics of LLM inference.
AI Perf benchmarking - Dynamo and other LLM endpoints
NVIDIA's 'AI Perf' is an excellent example of a modern, open-source tool designed specifically for this purpose. This video provides a great demonstration of its capabilities.
Watch the segment from 01:34 to 12:46. Pay close attention to the command-line arguments used to define the load (--concurrency, --request-count, --isl, --osl) and the resulting metrics table. This demonstrates how a specialized tool can directly measure the KPIs we care about, like TTFT and output token throughput.
The video showcases how a tool like AI Perf simplifies the process. A single command can simulate hundreds of concurrent users, each sending multiple requests with specific characteristics, and automatically calculate and aggregate the critical performance metrics. While you can build your own script (as shown in one of the readings), using a dedicated tool lets you focus on analyzing the results rather than building the testing harness.
Part 3: Designing and Executing Load Tests
A single performance number is not enough. To truly understand your service, you must test it under various load patterns. Each pattern reveals a different aspect of your system's behavior.
Metrics That Matter for LLM Inference
The 'Metrics That Matter' article again provides a succinct and practical list of essential load tests.
Read the section 'Load tests you should actually run'. Focus on the 'Ramp test', 'Burst test', and 'Mixed prompts' test. Understand the purpose of each one.
Let's review the most important test types:
-
Ramp Test:
- Purpose: To find the system's saturation point.
- Method: Gradually increase the number of concurrent users (e.g., 1, 10, 25, 50, 75, 100...) while keeping the request profile constant.
- What to Look For: Initially, throughput (TPS) should increase linearly with concurrency. At some point, it will plateau—this is your maximum throughput. If you continue to increase load, you'll likely see throughput decrease and latencies (TTFT, ITL) skyrocket as the system becomes overloaded.
-
Burst Test:
- Purpose: To test the system's stability and responsiveness to sudden spikes in traffic.
- Method: Immediately send a large number of concurrent requests (e.g., your expected peak load) to a system at rest.
- What to Look For: Does the system remain stable, or does it crash (e.g., with out-of-memory errors)? How quickly does it process the burst and return to normal? This test is excellent for uncovering issues with schedulers and resource allocation.
-
Mixed-Prompt Test:
- Purpose: To simulate a realistic user workload.
- Method: Send a mix of requests with varying input and output lengths (e.g., short questions with long answers, long documents for summarization).
- What to Look For: How does the scheduler handle the mix? Do long requests "starve" shorter ones? This tests the fairness and efficiency of your batching and scheduling logic (which we covered in Module 8).
Practical Exercise: Running a Ramp Test
Now it's your turn. You will perform a ramp test against the containerized service you deployed in the last lesson. You can use a tool like AI Perf, ghz, or write a simple Python asyncio script to generate the load.
Instructions:
- Ensure your containerized service from the previous lesson is running.
- Design a ramp test that starts at 1 concurrent user and increases in steps (e.g., 5, 10, 20, 40, 60, 80, 100).
- For each concurrency level, send a fixed number of requests (e.g., 200) with a consistent prompt and max output tokens.
- At each step, record the overall Output Token Throughput (TPS) and the p95 TTFT.
- Plot your results:
- Graph 1: Concurrency (x-axis) vs. Throughput (y-axis)
- Graph 2: Concurrency (x-axis) vs. p95 TTFT (y-axis)
- Analyze your graphs. Where does the throughput saturate? At what point does the p95 TTFT start to degrade significantly and violate your SLO of 800ms?
This exercise will give you a concrete performance profile of your service and identify its current capacity limits.
Part 4: Advanced Load Testing Concepts
Simple synthetic tests are a great start, but to be truly confident in production, you need to simulate reality more closely.
Trace-based Replay
Instead of generating synthetic prompts, you can replay a trace of actual production traffic. This provides the most realistic workload possible, with natural distributions of prompt lengths, user behavior, and request timing.
AI Perf benchmarking - Dynamo and other LLM endpoints
The 'AI Perf' video demonstrates this powerful technique using the open-source 'Moon Cake' dataset, which is an anonymized trace of real user traffic.
Watch the segment from 21:09 to 27:38. Understand the concept of replaying a trace with its original timing ('fixed schedule'). The speaker also explains how this method is ideal for A/B testing the impact of optimizations like KV Caching, as it provides a consistent, realistic workload.
"Goodput" Analysis
Standard metrics give you averages and percentiles, but they don't directly answer the question: "What percentage of my users had a good experience according to my SLOs?" This is where "goodput" analysis comes in.
AI Perf benchmarking - Dynamo and other LLM endpoints
Let's return to the 'AI Perf' video one last time to see how to directly measure against our SLOs.
Watch the segment on 'goodput analysis' from 30:32 to 33:22. The key idea is that you can pass your SLO targets (e.g., TTFT and latency SLAs) directly to the benchmarking tool. The output then tells you not just the total throughput, but the 'goodput'—the throughput of requests that actually met your performance criteria. This is a much more business-relevant metric.
This approach transforms your analysis from "The p95 TTFT was 950ms" to "Only 78% of our requests met the 800ms TTFT SLO under this load," which is a far more powerful statement when making decisions about scaling or optimization.
Conclusion
You have now reached the final stage of preparing your service for production. By moving beyond simple execution to rigorous, high-concurrency load testing, you've adopted the mindset of an AI Systems Engineer, who is responsible not just for building models but for ensuring they run efficiently, reliably, and cost-effectively at scale.
Key Takeaways:
- Load testing is about measuring against business goals (SLAs/SLOs), not just achieving raw performance numbers.
- LLM inference requires specialized metrics (TTFT, TPS) and tools that can handle streaming and token-based calculations.
- Systematic test patterns (ramp, burst, mixed) are crucial for discovering different performance characteristics like saturation points and stability under pressure.
- Advanced techniques like trace-replay and "goodput" analysis provide a more realistic and actionable assessment of production readiness.
This lesson completes our journey through the production systems module. The skills you've acquired—from profiling and instrumentation to containerization, deployment, and now load testing—form the core toolkit for operating high-performance AI services. You are now equipped to answer not just "what can this model do?" but "how does this model perform under the pressures of the real world?".