
Hello! Welcome to your first lesson. I'm excited to help you start your journey toward creating compelling data visualizations for financial markets.
Getting Started: Acquiring the Raw Materials
In this lesson, we'll tackle the first crucial step in any data analysis project: getting the data. Before you can build insightful charts and dashboards, you need to bring the raw financial data into your primary tool, Excel.
We will focus on two of the most common ways you'll encounter financial data: as tables on websites and as downloadable CSV files. By the end of this session, you'll be able to confidently import data from both sources, setting a solid foundation for the rest of the course.
Let's begin.
1. Importing Data from the Web with Power Query
Often, the data you need—like company financial statements or market indices—is available on public websites. Instead of manually copying and pasting this information (which is slow and error-prone), we can instruct Excel to fetch it directly from the source. The tool for this job is called Power Query.
Power Query is a data connection and transformation engine built into Excel. Think of it as your personal data assistant that can go to a website, grab a specific table, and bring it into your spreadsheet. Even better, it remembers these steps, allowing you to refresh the data with a single click later.
This image gives you a high-level overview of the process:

To see this in action, let's watch a video that demonstrates how to pull financial data directly from a company's annual report and a financial news site.
How To Import Company Financials Into Excel
This video from HowToAnalyst demonstrates how to use the 'Get Data from Web' feature. Pay close attention to how the presenter navigates to the data source, selects the correct table, and uses the Power Query editor for minor adjustments.
Please watch the following two segments. The first part shows how to import a table from a company's online annual report. The second part shows how to do the same from The Wall Street Journal's website, including a useful filtering trick.
As you saw, the key steps are:
- Go to the Data tab.
- Click Get Data > From Other Sources > From Web.
- Paste the URL of the page containing the data.
- Excel's Navigator window will show you all the tables it found on that page. Select the one you need.
- Click Transform Data to open the Power Query editor for cleanup (like removing empty columns) or Load to import it directly.
This method is incredibly powerful for grabbing structured data like financial statements, economic indicators, or historical data tables from sites like Yahoo Finance or your own brokerage's research portal.
For a detailed written guide that you can refer back to, the following resource covers this same process.
How to Import Stock Data into Excel
This article from Graphed provides a clear, step-by-step guide on using Power Query to import data from Yahoo Finance.
Please read the section titled 'Method 3: Importing Data From a Web Source with Power Query'. This will reinforce what you saw in the video and provide a concrete example using Yahoo Finance.
2. A Direct Line to Stock Prices: The STOCKHISTORY Function
While Power Query is great for general web data, Excel has a specialized function for one of the most common tasks in financial analysis: retrieving historical stock prices. If you have a Microsoft 365 subscription, the STOCKHISTORY function is the most direct way to pull daily, weekly, or monthly price data (Open, High, Low, Close, Volume) for a specific stock.
This function is a "dynamic array" function, meaning a single formula can return a full table of data.
Let's watch a short video that explains exactly how to use it.
Get any STOCK DATA you want using EXCEL ONLY | STOCKHISTORY FUNCTION
This video from Mo Chen provides an excellent, concise walkthrough of the STOCKHISTORY function, explaining each of its arguments and demonstrating a practical example.
Watch the video from the beginning to the end. It starts by introducing the function, explains its syntax, shows a complete example, and finally demonstrates how easy it is to change the ticker to get data for another stock.
To summarize the key arguments of the function:=STOCKHISTORY(stock, start_date, [end_date], [interval], [headers], [properties...])
- stock: The ticker symbol, e.g.,
"MSFT"for Microsoft. For Indian stocks, you'll often need the exchange suffix, like"RELIANCE.NS"for Reliance Industries on the National Stock Exchange. - start_date: The beginning of the period you want data for.
- end_date (optional): The end of the period. If omitted, it returns data for the start date only.
- interval (optional):
0for daily (default),1for weekly,2for monthly. - headers (optional): Whether to include a header row in the output.
- properties (optional): Which data columns to return (e.g.,
0for Date,1for Close,2for Open, etc.).
Test your understanding!
You want to get the daily closing prices for Infosys (ticker: INFY.NS) for the month of October 2023. Which formula would you use? Think about the stock, start_date, end_date, interval, and which properties you need.
Show answer
A correct formula would be:=STOCKHISTORY("INFY.NS", "2023-10-01", "2023-10-31", 0, 1, 0, 1)
Let's break it down:
"INFY.NS": The stock ticker."2023-10-01": The start date."2023-10-31": The end date.0: For daily interval.1: To show headers.0, 1: To show the Date (property 0) and the Close price (property 1).
3. Importing from Local Files: The CSV
Finally, a vast amount of financial data is shared in .csv (Comma-Separated Values) files. These are simple text files that use commas to separate data into columns, and you can download them from many financial data providers, stock exchanges (like BSE and NSE), or export them from other software.
Importing a CSV file into Excel uses a process very similar to the web import, and it also leverages Power Query.
The steps are straightforward:
- Go to the Data tab.
- In the "Get & Transform Data" group, click From Text/CSV.
- In the dialog box that appears, navigate to and select the CSV file you saved on your computer. Click Import.
- A preview window will appear, showing you what the data looks like. Excel is usually smart enough to detect the delimiter (like a comma) and format the columns correctly.
- Just like with a web query, you can click Load to bring it into Excel or Transform Data to make adjustments in Power Query first.
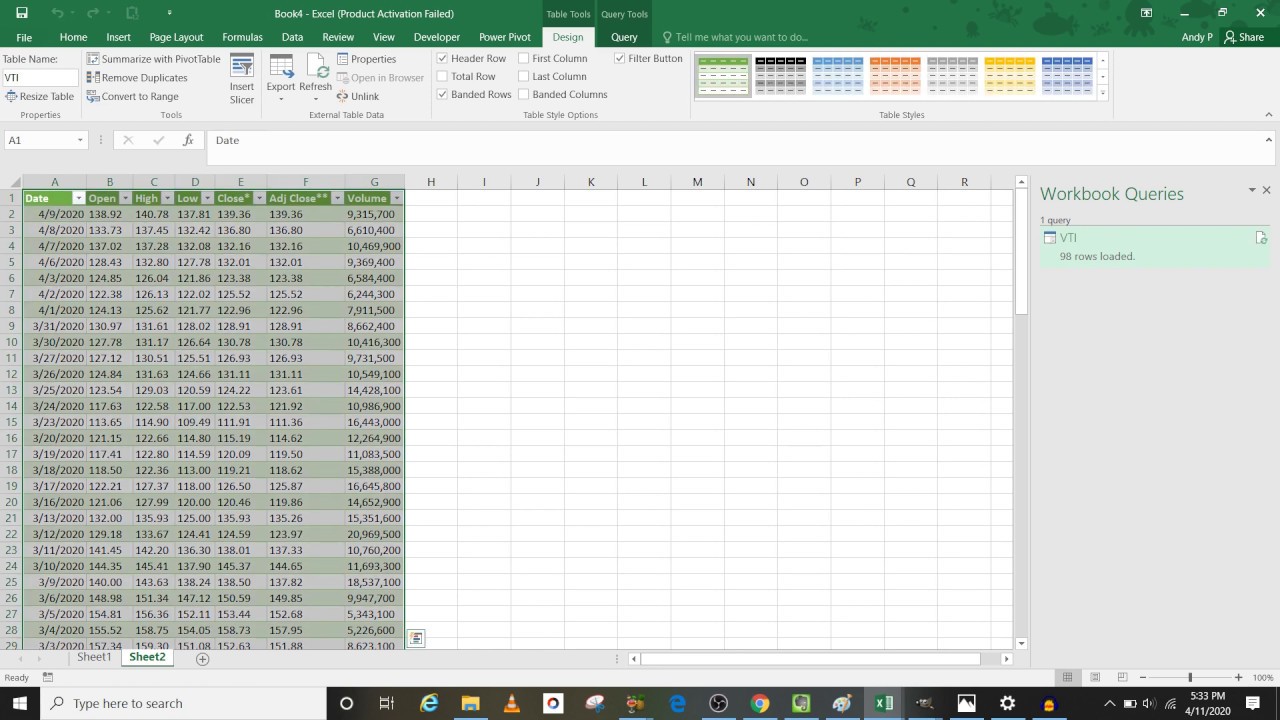
When you load the data, Excel will format it as a proper Table. This is a special structure that we will explore in our next lesson, but for now, know that it keeps your data organized. The result looks clean and ready for analysis.
Lesson Summary and Next Steps
Great work! You've just learned the foundational skill of data acquisition in Excel. Let's recap the key methods:
- Power Query (From Web): Your go-to tool for importing structured data tables from websites. It's robust, repeatable, and allows for data cleaning before loading.
- The
STOCKHISTORYFunction: A fast and direct formula for pulling historical stock price and volume data, perfect for time-series analysis. - From Text/CSV: The standard method for importing data from the ubiquitous
.csvfile format.
You now have the tools to pull in the raw materials for any financial visualization project.
In our next lesson, we'll focus on what to do after the data is imported. We will learn how to format and structure financial data tables for analysis and visualization, ensuring your data is clean, organized, and perfectly prepared for the charting techniques we'll cover later.
Can't find a good explanation? Sign up and we'll make it for you
Sign up