
Hello! Welcome back to our module on Marketing Mix Modeling.
In the last lesson, we focused on how to critically assess an MMM. You learned the right questions to ask to ensure a model is robust, reliable, and grounded in reality. This critical skill is your first line of defense against making poor decisions based on flawed analysis.
Now that we have a model we can trust, we'll move from evaluation to application. This lesson dives into one of the most powerful and strategic uses of MMM: optimizing your marketing budget. Our learning outcome is to use MMM-derived response curves to inform optimal budget allocation across channels. This is where analytics directly translates into business impact, enabling you to move from simply reporting on past performance to actively shaping future growth.
1. Understanding the Response Curve
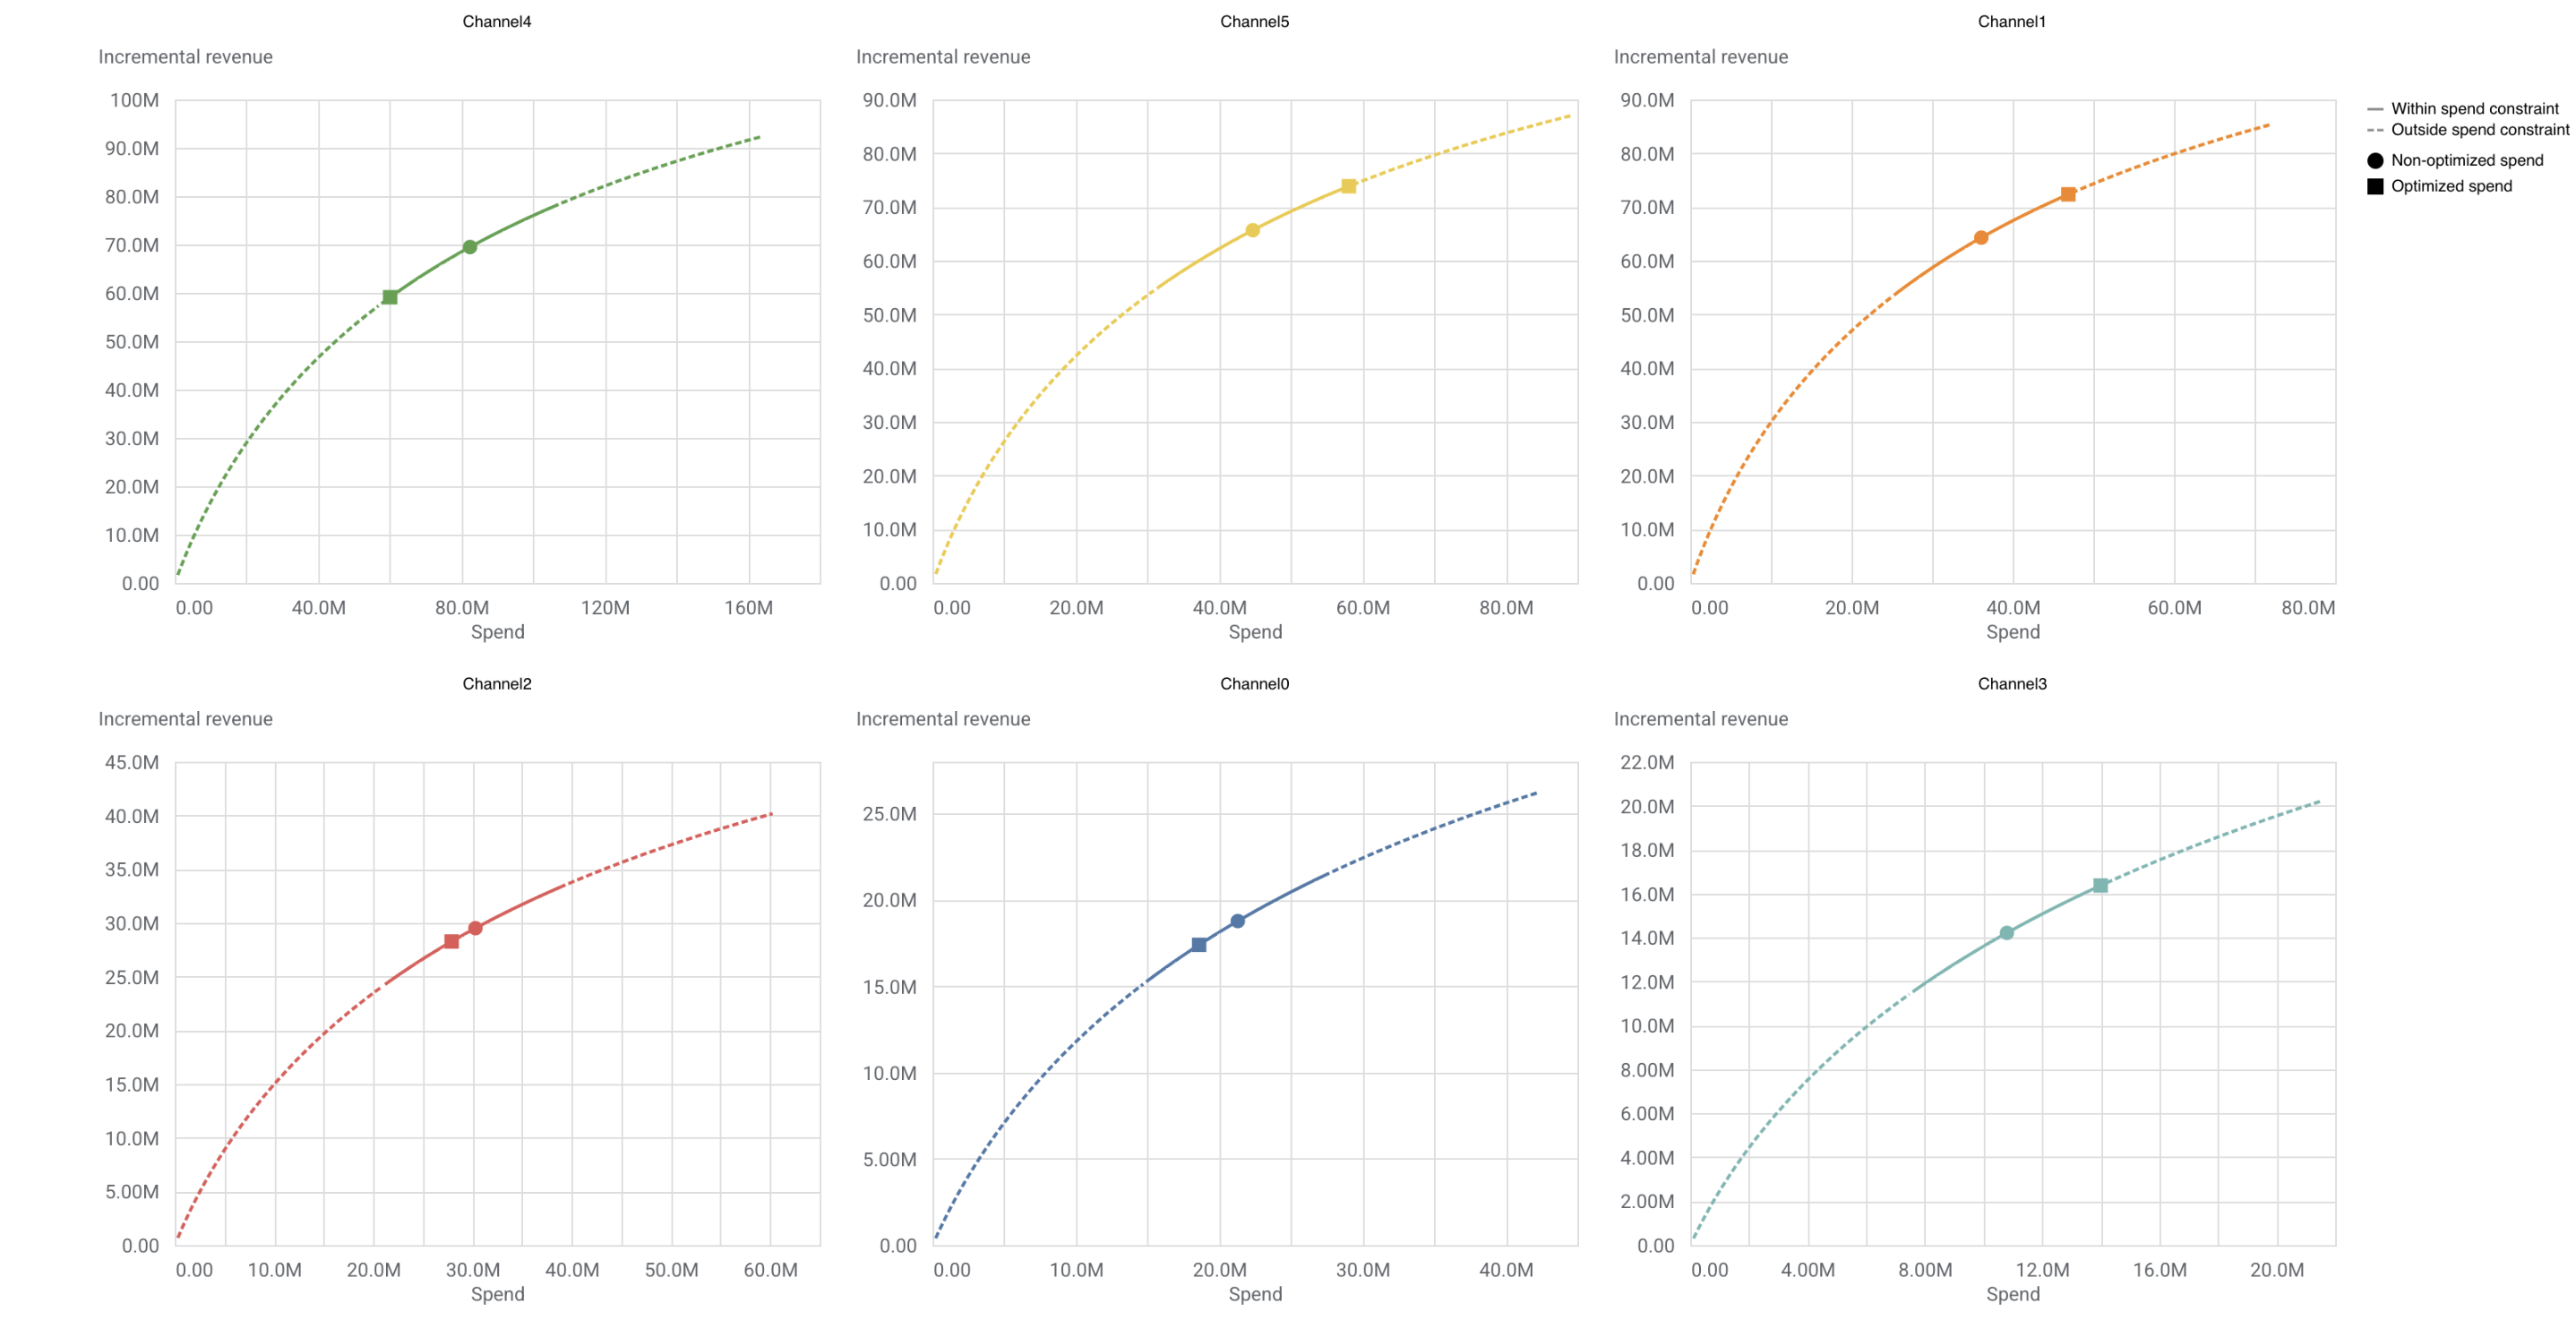
At the heart of MMM-based budget allocation is the response curve. It's a graph that visualizes the relationship between the money you spend on a marketing channel and the business outcome it generates (e.g., sales, conversions).
Crafting Media Guidelines with Response Curves in Market ...
To start, let's get a clear definition of response curves and see the common shapes they take. This article by Rajiv Gopinath provides a concise introduction.
Please read the sections 'Response curves' and 'Types of Response Curves'. Focus on understanding the S-shaped and Concave curves, as they are the most common in marketing.
As the article explains, while a linear response is simple, it's rarely realistic. Most marketing channels exhibit diminishing returns, leading to two common curve shapes:

- Concave Curve: Every additional dollar you spend generates a slightly smaller return than the one before it. This is typical for mature, direct-response channels like branded search, where you capture the most eager customers first.
- S-Shaped Curve: This is common for channels that require a certain level of investment to break through the noise, like TV or broad awareness campaigns. There's an initial "threshold" spend needed to see any real impact, then a period of high efficiency, followed by saturation.
2. From Average ROI to Marginal ROI: The Key to Optimization
To use these curves for budgeting, we need to shift our thinking from average ROI to marginal ROI. This is the single most important concept for budget optimization.
The Profit Curve Playbook: Smarter Spending through MMM
The article 'The Profit Curve Playbook' does an excellent job of explaining this crucial distinction from a strategic leader's perspective.
Please read the section 'From Average ROI to Marginal ROI'. Pay close attention to the definition of marginal ROI and the chart that compares the two. The core idea is understanding when to stop spending.
Let's break this down:
- Average ROI =
Total Revenue from Channel / Total Spend on Channel. This looks backward. It's useful for end-of-quarter reports to summarize overall efficiency. - Marginal ROI =
Revenue from the *next* dollar spent. This looks forward. It answers the question, "If I had one more dollar, where should I put it to get the best return?"
The article highlights a critical insight: Your total profit is maximized at the point where your marginal ROI equals your hurdle rate. For simplicity in many models, this hurdle rate is effectively a marginal ROI of 1 (or a marginal net profit of 0), meaning the next dollar spent brings in exactly one dollar of revenue. Beyond this point, you're losing money on each additional dollar spent, even though your average ROI might still look healthy.
This is the antidote to the "underspending trap" mentioned in the first part of that same article. Many teams stop spending when average ROI is still high, leaving profitable growth on the table because they lack visibility into their marginal returns.
3. The Golden Rule of Budget Allocation
Now, how do we apply this across a portfolio of channels like Google Ads, Meta Ads, and TV? The principle is surprisingly simple:
You achieve the most efficient total budget allocation when the marginal ROI is equal across all your active channels.
Think about it intuitively. If your next dollar spent on Google Ads yields a $2.50 return (marginal ROI = 2.5), but on Meta Ads it only yields $1.20 (marginal ROI = 1.2), your budget is not optimized. You have an opportunity to improve your total return without spending more money. You should move a dollar from Meta to Google. You would continue to do this until the marginal returns equalize. As you spend more on Google its marginal ROI will decrease, and as you spend less on Meta its marginal ROI will increase. Eventually, they will meet.
Let's see a practical example.
Crafting Media Guidelines with Response Curves in Market ...
This article provides a perfect, simple case study of reallocating budget between a high-ROI, saturated channel and a lower-ROI, unsaturated channel.
Please read the final section of the article, starting from the chart comparing TV and Search and the accompanying text. This directly illustrates the core concept of cross-channel optimization.
As the example shows, even though TV has a higher average ROI, it is so saturated that its marginal ROI is very low. By moving budget to the less saturated Search channel, the gain from Search is more significant than the loss from TV, resulting in a higher total net revenue for the same overall budget.
This is what budget optimization looks like in practice. It's not about cutting spend, but about reallocating it to the point of highest efficiency.
Test your understanding!
Your analytics team presents you with the following data from your MMM:
- YouTube Ads: Current spend is $200k/month. The marginal ROI is 3.1.
- TikTok Ads: Current spend is $150k/month. The marginal ROI is 1.8.
You have been given an additional $50k to invest this month. How would you recommend allocating it, and why?
Show answer
You should allocate the entire $50k to YouTube Ads.
The reason is that its marginal ROI is significantly higher (3.1 vs. 1.8). This means the next dollar invested in YouTube is expected to generate $3.10 in return, compared to just $1.80 from TikTok. By allocating the funds to the channel with the higher marginal return, you maximize the overall impact of your incremental budget. This decision focuses on future returns, not past average performance.
4. Your Workflow as a Strategic Leader
As a marketing leader, your role isn't to calculate the derivatives that define these curves, but to use the outputs to make strategic decisions and guide your team. Here is a practical workflow:
-
Define Key Points on the Curve: Work with your analytics team to identify the threshold, optimal, and saturation points for each channel.
- Threshold: The minimum spend needed to have an effect. Are you spending enough to even get on the board?
- Saturation: The point of diminishing returns. Where are you overspending and wasting budget?
- The article "Crafting Media Guidelines..." defines these points clearly in the section "Understanding Media Response Curves." Your data science team can pinpoint these mathematically, but your job is to understand their strategic implications.
-
Identify Imbalances: Plot your current spend on each curve. Ask your team: "What is the marginal ROI for each of our major channels at their current spend levels?" Look for large discrepancies—these are your optimization opportunities.
-
Simulate and Reallocate: Use the MMM's simulation capabilities to answer "what if" questions. Frame your requests around business goals:
- "Model a scenario where we shift 20% of our TV budget to YouTube. What is the forecasted impact on total sales?"
- "What is the optimal allocation to maximize revenue with our current budget of $5M for Q4?"
- "To hit our revenue target of $25M, what is the most efficient budget we need and how should it be allocated?"
-
Build the Business Case: Translate the model's output into a compelling business narrative. Instead of saying, "We need to reallocate budget to equalize marginal ROIs," say:
"By shifting $500k from our saturated TV campaigns to our highly efficient YouTube program, the model forecasts a net increase of $1.5M in revenue for the quarter at the same total marketing spend. This move increases our overall portfolio ROI from 3.5x to 3.8x."
This approach connects the analytical exercise directly to the financial goals of the business, which is the hallmark of strategic marketing leadership.
Conclusion
Today, we've moved from the theory of MMM to its practical application in one of the most critical functions of a marketing leader: budget allocation.
Key Takeaways:
- Response curves are the foundation for budget optimization, showing you where you are on the curve of diminishing returns for each channel.
- Decisions about future spending should be guided by marginal ROI, not average ROI.
- The goal of budget optimization is to allocate spend such that the marginal ROI is equal across all channels, ensuring every dollar is working as hard as it possibly can.
- Your role as a leader is to use these insights to identify opportunities, ask the right "what if" questions, and build a compelling business case for budget changes that drive more profit.
Preview of the Next Lesson:
We've established the core principle of using response curves for optimization. In the next lesson, we will go one step further and learn how to use MMM scenario planning tools to forecast the impact of different budget scenarios. We will explore how to answer questions from the C-suite about the potential outcomes of increasing or decreasing the overall marketing budget, making you a more valuable strategic partner in financial planning discussions.