
Hello! Welcome back to our exploration of Marketing Mix Modeling.
In our last lesson, we established the core principle of budget optimization: using response curves and marginal ROI to reallocate a fixed budget for maximum efficiency. You learned that the goal is to shift spending from saturated, low-return channels to unsaturated, high-return channels until their marginal ROI is equal.
Today, we take the next logical step. Instead of just optimizing the budget you have, you'll learn how to forecast the future. Our learning outcome is to use MMM scenario planning tools to forecast the impact of different budget scenarios. This is one of the most strategic applications of MMM, transforming it from a backward-looking report card into a forward-looking GPS for your business. This skill will empower you to have data-driven conversations about budget with finance and the C-suite, justify investment requests, and strategically navigate potential cuts.
1. What is Scenario Planning?
At its core, scenario planning is about using your MMM to answer sophisticated "what if" questions. It allows you to simulate the likely outcomes of various budget strategies before you commit a single dollar.
What Is Marketing Mix Modeling A Complete Guide
To start, let's get a clear definition of scenario planning and the types of strategic questions it can answer. This article from Cometly provides an excellent, business-focused overview.
Please read the sections titled 'Forecasting the Future with Scenario Planning' and 'Common Scenarios to Model'. Focus on how it transforms marketing from intuition to prediction and note the examples of questions it can answer.
As the article highlights, scenario planning moves marketing from being reactive to proactive. Instead of just reporting on what happened, you can forecast what will happen under different conditions. As a leader, you'll constantly face questions like:
- Budget Cut Simulation: "The CFO wants to cut our marketing spend by 15%. Where can we cut to minimize the damage to our sales targets?"
- Growth Investment Planning: "We've secured an extra $1M in funding for Q4. What is the most effective way to allocate it to maximize incremental growth?"
- Strategic Reallocation: "What would happen to total revenue if we shifted 30% of our TV budget into performance channels like paid search and social?"
Answering these questions with data-backed forecasts is a critical capability for any modern marketing leader.
2. How MMM Simulators Work
Scenario planning tools are essentially optimization engines built on top of the response curves we discussed in the last lesson. They take your "what if" question and use the curves to find the budget allocation that best achieves your goal.
Most MMM tools, including open-source libraries like Meta's Robyn, allow for two primary types of scenarios:
-
Fixed Budget Optimization (
max_historical_response): This is what we covered last lesson. The tool answers: "Given my current total spend, what is the optimal channel mix to maximize revenue?" The total budget doesn't change, but the allocation does. -
Variable Budget Forecasting (
max_response_for_expected_spend): This is our focus today. The tool answers: "Given a new total budget (either higher or lower), what is the optimal allocation, and what is the forecasted impact on revenue?"
This second scenario type is what allows you to forecast the outcomes of different investment levels.
3. Interpreting Scenario Planner Outputs: A Walkthrough
Your role isn't to run the code, but to provide the strategic inputs and interpret the results. Let's walk through what this looks like using Meta's Robyn budget allocator as a common example.
Ep. 5 - Marketing Mix Modeling: Maximize ROI with Facebook Robyn Budget Allocator
This video provides a great hands-on demonstration of the Robyn budget allocator. While it shows the R code, your focus should be on the concepts: the types of scenarios, the importance of constraints, and how to read the output charts.
Please watch from 05:18 to 15:14. Pay close attention to the distinction between the two scenarios ('max historical response' and 'max response expected spend') and the explanation of the three output plots. This will show you exactly what to look for in a report from your analytics team.
Based on the video, here is your workflow for using a tool like this:
Step 1: Define the Scenario and Constraints
First, you provide the prompt. This includes the total budget you want to simulate and, crucially, the business constraints.
The video mentions channel_constraint_low and channel_constraint_up. These are your guardrails. A pure mathematical optimization might suggest shutting down a channel completely. As a leader, you know this is often unrealistic due to:
- Contractual Obligations: You may have annual commitments with agencies or media partners.
- Brand Building: A channel like TV might have a low direct mROI but be critical for long-term brand health.
- Team Capabilities: Shifting 80% of your budget to a new channel might not be feasible for your current team.
- Strategic Goals: You may need to maintain a presence in a certain channel for competitive reasons, regardless of its immediate ROI.
Setting constraints (e.g., "don't reduce spend in any channel by more than 30%" or "don't increase spend by more than 50%") makes the model's output both realistic and actionable.
Step 2: Interpret the Output Plots
The allocator tool will generate a series of charts that summarize its recommendation. Let's use the onepager from Robyn as a guide.
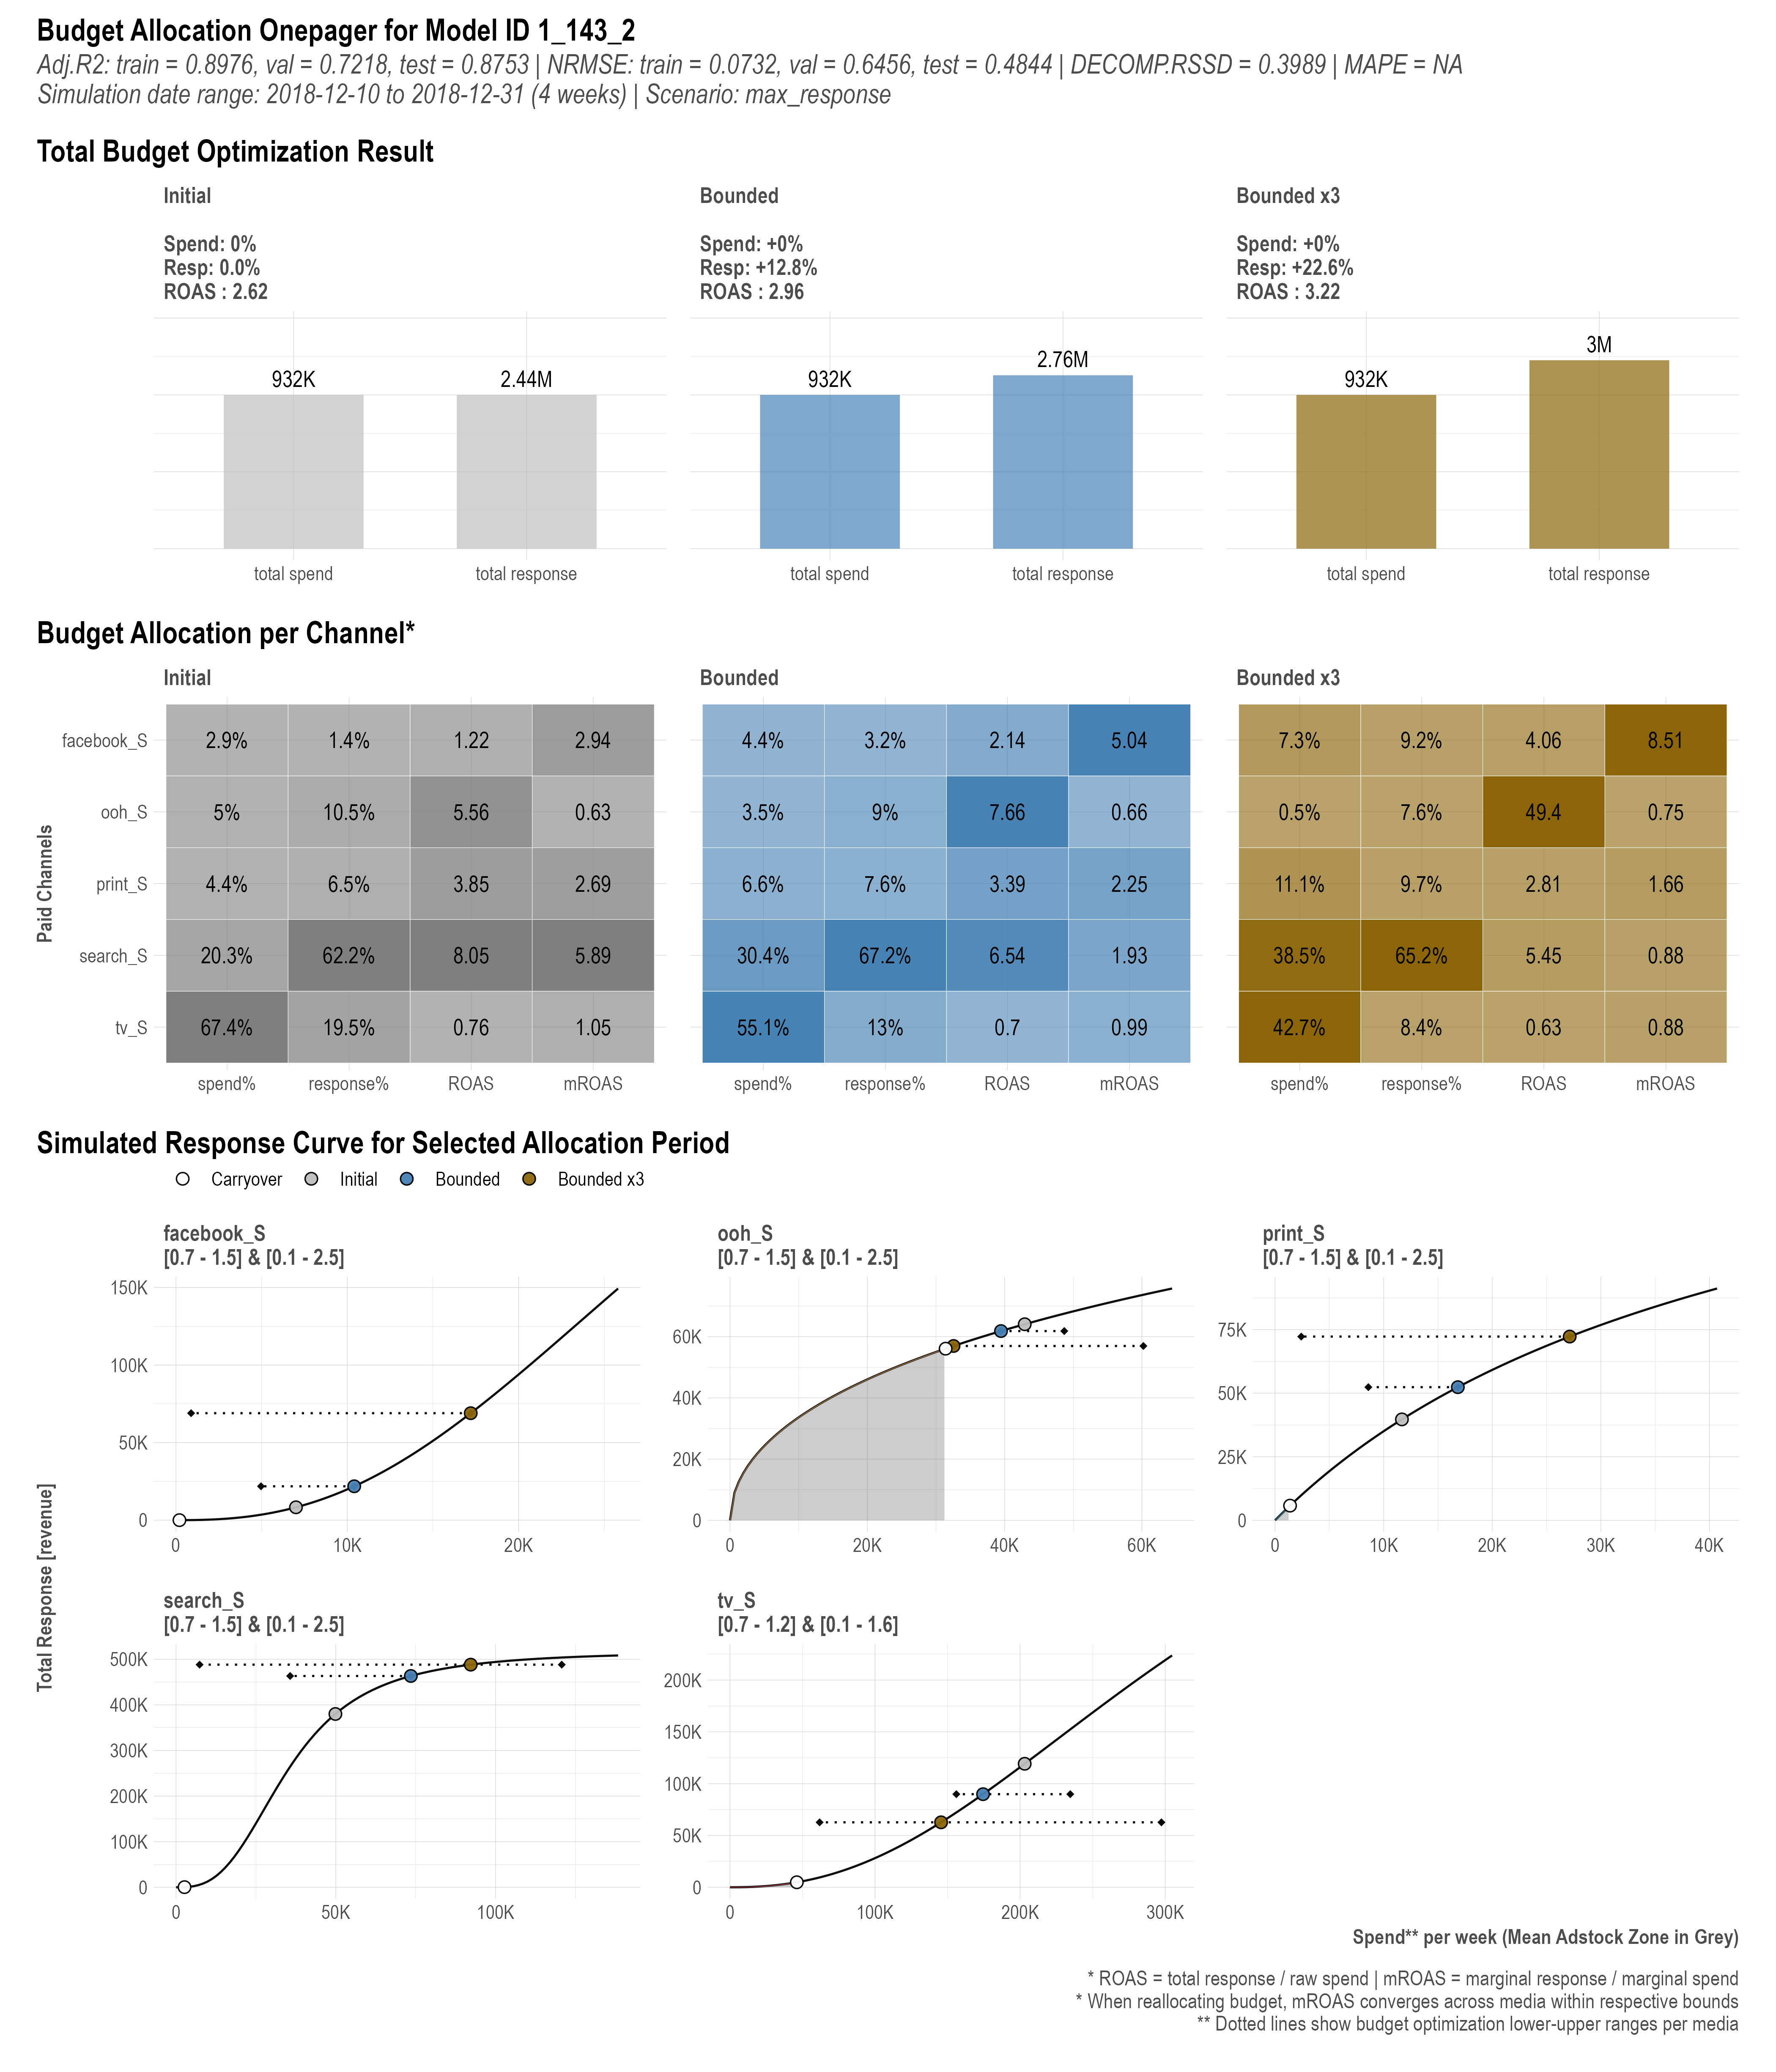
The key things to interpret from this output are:
-
Top-Line Impact: The top section shows the overall result.
- Initial: Your current spend and resulting revenue.
- Optimized: The new proposed spend, the new forecasted revenue, and the resulting change. This is your headline number: "By increasing our budget by 10% and reallocating it, the model forecasts a 22% increase in marketing-driven revenue."
-
Recommended Allocation Shift: The middle chart shows the "before and after" for your channel mix.
- Look at the
initial_spend_sharevs.optimal_spend_share. - Where are the big shifts? In the example, the model suggests dramatically reducing OOH (Out-of-Home) and shifting that spend primarily to TV and Search.
- Look at the
-
Justification via Response Curves: The bottom charts connect the recommendation back to the underlying data.
- They show where your initial spend (circle) is on each curve versus where the optimized spend (triangle/square) would be.
- You can see if a channel is being cut because it's far into saturation (like OOH) or being increased because it has lots of room to grow before its curve flattens (like TV and Search).
Test your understanding!
Looking at the "Budget Allocation Onepager" image above, your analytics lead points to the "Print" channel. They tell you the model suggests increasing its budget share from 7.7% to 11.2%. How would you explain the rationale for this increase to a non-technical stakeholder, using the concept of response curves?
Show answer
You could say something like: "Our model shows that for our Print channel, we're currently spending at a point on the response curve where it's still very steep. This means each additional dollar we invest there is generating a very high return. We haven't hit the point of diminishing returns yet. The model's simulation indicates that by shifting more budget into Print, we can capture more of that efficient growth before its response curve starts to flatten out, leading to a higher overall return for our total marketing investment."
4. From Simulation to Business Case: A Real-World Example
Let's see how this plays out in practice with a concrete case study.
Marketing Mix Modelling implementation | A real MMM case study from an expert data analyst
This video from Funnel presents a concise MMM case study for a retail client. It perfectly illustrates how scenario planning is used to answer core business questions about budget increases and optimization.
Please watch the sections covering the business question (01:51 - 02:53), the recommendations (08:45 - 10:28), and the final outcome (10:28 - 10:56).
This case study demonstrates the two scenario types beautifully:
- Conservative Scenario (Fixed Budget): The model first recommended optimizing the existing budget. By reallocating funds from underperforming channels (like Print) to over-performing ones (like TV and Online Video), they could increase sales by 15% without increasing spend.
- Aggressive Scenario (Variable Budget): The model then simulated a budget increase of 15%, combined with optimization. The forecast for this scenario was a 25% increase in sales.
The client chose the conservative path and actually exceeded the forecast, increasing store visits by 17%. This shows the power of using MMM to de-risk decisions and build confidence in a marketing plan.
5. Presenting Your Forecast
Finally, your job is to synthesize these complex outputs into a simple, compelling business case. A simple table is often most effective.
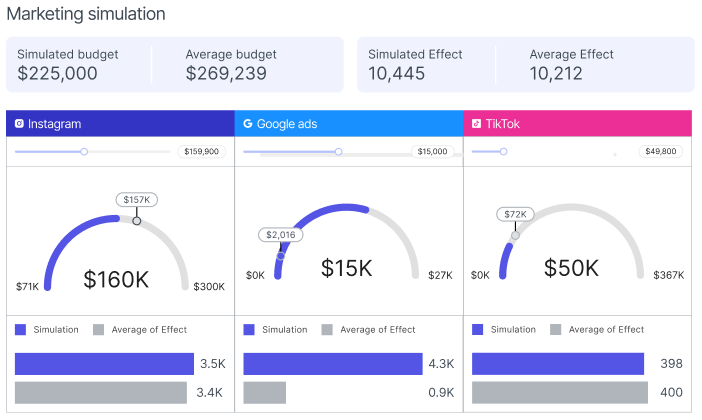
Whether it's an interactive dashboard or a static table, your presentation should clearly articulate the plan.
Example Forecast Summary
| Channel | Current Spend | Current mROI | Proposed Spend | Change | Forecasted Revenue |
|---|---|---|---|---|---|
| TV | $50,000 | 1.8 | $35,000 | -30% | $95,000 |
| Digital | $40,000 | 5.2 | $60,000 | +50% | $290,000 |
| Social | $30,000 | 6.1 | $55,000 | +83% | $300,000 |
| Total | $120,000 | $150,000 | +25% | $685,000 (+15%) |
This format clearly shows the requested budget increase (+25%), how it will be allocated (shifting from low-mROI TV to high-mROI Digital/Social), and the expected business outcome (+15% revenue).
Conclusion
Today, you've learned how to leverage MMM as a powerful forecasting tool. This moves you from reporting on the past to strategically shaping the future.
Key Takeaways:
- Scenario planning uses MMM to run "what if" simulations for different budget levels and allocations.
- As a leader, your role is to define the business questions and provide realistic constraints to guide the model.
- Interpreting the outputs involves understanding the top-line impact, the proposed channel mix changes, and the justification from the underlying response curves.
- The ultimate goal is to synthesize these findings into a clear, data-driven business case to justify budgets and forecast financial outcomes.
Preview of the Next Lesson:
We have now covered the core strategic outputs of an MMM: contribution, response curves, and scenario planning. But how do you get a project like this off the ground? In our next lesson, we will focus on a crucial leadership task: "Develop a comprehensive brief for commissioning an MMM project from a vendor or internal team." You'll learn how to define your business questions, scope the project, and set your team or partner up for success from day one.