
Good to see you again. In the previous lesson, you built the structural part of your outlook: weak capital formation and infrastructure were the strongest broad explanation for sluggish productivity, with skills and innovation as a complementary constraint, and trade frictions and policy uncertainty as an important amplifier.
This final lesson turns that diagnosis into a usable one-page UK economic outlook brief. You will compare what the OBR, Bank of England, and IMF are actually projecting, identify the assumptions doing the work in each forecast, and then state your own conditional view for the next 1–2 years and the next 5–10 years. The goal is not to discover “the correct forecast.” It is to make a judgement that can be updated as evidence arrives.
A forecast is a conditional design, not a promise
Institutional forecasts often look like confident numbers: UK growth will be , inflation will return to target by a particular date. But each number is conditional on a set of assumptions about energy prices, interest rates, fiscal policy, global demand, trade, and behaviour by firms and households.
A useful product-design parallel is a prototype tested under stated constraints. Its output is meaningful, but only if you know the inputs, the intended use, and what would cause the result to change. Economic forecasts deserve the same treatment.
For every forecast, use this five-part audit:
- What is being forecast? Annual growth, quarterly growth, inflation, unemployment, or something else?
- What date and data vintage does it use? A March forecast and a July forecast already embody different information.
- What must be true for it to hold? Energy prices, financial conditions, policy settings, world growth, and household or business behaviour.
- What mechanism connects assumptions to the outcome? For example, expensive energy can reduce real incomes, weaken spending, raise firms’ costs, and keep inflation high.
- Which incoming data would confirm or challenge it? This turns passive consumption of forecasts into an updateable view.
The institutions also have different purposes:
| Institution | Primary role | What to expect from its forecast |
|---|---|---|
| OBR | Independently assesses the public-finance and economic outlook used in UK fiscal policy. | A medium-term baseline relevant to tax, spending, borrowing, and fiscal rules. |
| Bank of England | Sets monetary policy to return inflation sustainably to the target. | Detailed analysis of inflation, wages, demand, spare capacity, and interest-rate conditioning assumptions. |
| IMF | Assesses national economies within the world economy. | A cross-country view in which global growth, commodity prices, trade, and financial conditions are particularly important. |
This difference does not mean one institution is neutral and the others are biased. It means their forecasts answer partly different questions.
First, normalise the apparent disagreement
The OBR chart below provides a compact view of its March 2026 growth forecast revision.
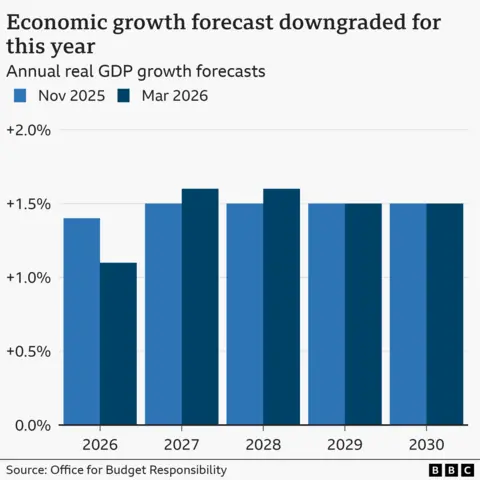
The visual tells a specific story: weaker near-term momentum, with some growth deferred rather than lost permanently. It does not, by itself, tell us why the OBR changed its view. Avoid attributing an energy-price, tax, or productivity assumption to the OBR unless you have its accompanying forecast documentation.
Now compare the headline projections available in the supplied sources.
| Institution and forecast vintage | 2026 growth | 2027 growth | Later horizon | Important interpretation note |
|---|---|---|---|---|
| OBR, March 2026 | in 2028; in 2029–30 | Annual real GDP growth; values read from the supplied OBR chart. | ||
| IMF, April 2026 | No UK-specific 5–10 year number in the selected material | Annual real GDP growth. | ||
| Bank of England, July 2026 central projection | in 2026 Q3 | in 2027 Q3 | in 2028 Q3; in 2029 Q3 | Four-quarter GDP growth, not calendar-year annual growth. |
At first glance, the IMF looks substantially more pessimistic than the OBR. That is a reasonable starting observation: the IMF projects growth in 2026 versus the OBR’s .
But do not compare the Bank’s for 2026 Q3 directly with the OBR’s for calendar-year 2026. They use different measures:
- Annual growth compares the average level of GDP in one calendar year with the previous year.
- Four-quarter growth compares one quarter with the same quarter a year earlier.
A rebound late in a year, for example, can produce a modest annual figure while giving a stronger four-quarter rate by the end of that year. Differences in definition are not necessarily differences in economic judgement.
Read the assumptions, not just the headline
The Bank of England’s July report is especially useful because it exposes the logic underneath its central forecast and offers alternative scenarios.
[PDF] Bank of England Monetary Policy Report July 2026
Read the Bank of England’s July 2026 outlook section to see how a forecast becomes a set of explicit conditional scenarios. Its main value is not the central number alone, but the assumptions about energy prices, wage and price setting, fiscal policy, and market interest rates.
In Chapter 3, “Outlook, scenarios and risks” (pp. 74–80), begin with the scenario framing. Then study Table 3.A on pp. 75–76 and Table 3.B on pp. 79–80. Focus on what differs between the central, milder, and adverse cases, rather than trying to memorise every number.
The Bank’s central projection assumes:
- wholesale oil and gas prices follow the market futures curve available up to 20 July;
- moderate additional “second-round” effects, meaning higher energy costs feed somewhat into wage and price setting;
- interest rates follow the market-implied path used for the forecast;
- fiscal policy follows the government’s Budget 2025 plans, plus the stated temporary VAT and bus-fare measures.
Under those conditions, the Bank expects inflation to peak at around in late 2026, then fall back to around target during 2027. Growth remains subdued through 2026 and early 2027, before strengthening modestly as the real-income shock fades.
The key phrase is “conditioned on the market curve.” This is not a promise that Bank Rate will follow that exact path. It is an input used to generate a consistent projection. If inflation persistence turns out higher or lower than expected, the appropriate policy rate could differ.
The Bank’s alternative scenarios make the central vulnerability clear:
| Scenario | Energy-price assumption | Domestic response | Main economic implication |
|---|---|---|---|
| Milder | Slightly lower oil and gas prices than the central case | Weak demand and labour-market slack prevent new wage-price persistence | Inflation fades faster, but growth is somewhat weaker because households save more and demand is soft. |
| Central | Energy prices follow futures curves | Moderate second-round effects | Inflation falls back near target, with subdued but positive growth. |
| Adverse | Oil prices around higher and gas prices around higher than the central case, on average | Larger and more persistent wage and price effects | Inflation peaks much higher, growth weakens, and policy would probably need to be tighter than the market path. |
The adverse case is not merely “oil gets expensive.” It combines three mechanisms:
- Households lose purchasing power, reducing spending.
- Firms face higher energy and transport costs.
- If inflation expectations rise, wages and prices may keep rising even after the initial energy shock.
That final mechanism is why the Bank is monitoring wage settlements, firms’ pricing plans, profit margins, inflation expectations, labour-market slack, and the breadth of price increases.
Why the IMF is more cautious in the near term
The IMF’s April forecast was prepared earlier than the Bank’s July report, using a different global outlook and a shorter assumed duration for the Middle East conflict.
Chapter 1: Global Prospects and Policies; April 14, 2026
Read the IMF’s April 2026 global forecast to understand why its UK outlook is weaker than the OBR’s and how global assumptions enter a national forecast. The IMF makes the UK’s exposure as an energy importer and trade-dependent advanced economy more visible.
In “Growth Forecast for Advanced Economies” on p. 11, read the UK forecast passage. Then go back to “Global Assumptions” on pp. 5–6. Read the opening discussion of the conflict-duration assumption, followed by the bullet points on commodity prices, fiscal policy, and trade policy. Notice the forecast date: its futures-price information is from March, not July.
The IMF projects UK growth of in 2026 and in 2027. Its reasoning is direct:
- the conflict raises energy prices;
- as a net energy importer, the UK experiences a negative terms-of-trade shock;
- higher household energy costs reduce real disposable income;
- monetary easing is slower than previously expected;
- the recovery is therefore delayed, even if the energy disruption begins to fade.
The IMF reference forecast assumes that the conflict lasts a few more weeks, with disruption fading and regional production and exports normalising by mid-2026. It also assumes current fiscal and trade policies remain in place over the forecast horizon.
That is already a relatively optimistic geopolitical assumption. The IMF’s downside scenarios show why it matters. A more prolonged conflict, higher oil and gas prices, higher inflation expectations, and tighter financial conditions would damage global growth materially. For the UK, those channels would likely appear as higher imported inflation, weaker consumption, reduced business confidence, and higher financing costs.
There is a useful practical lesson in the OBR–IMF gap:
A difference between forecasts is often a difference between assumptions and forecast vintages, before it is a difference in competence.
The OBR’s March number, IMF’s April number, and Bank’s July scenarios should therefore not be averaged into a fake “consensus.” Instead, use them to identify the variables most likely to move your own outlook.
Move from forecasts to a conditional outlook
A sound outlook has three layers:
- Institutional baseline: what the official forecasters project under their assumptions.
- Your judgement: which mechanism seems most decision-relevant and how likely it is to persist.
- Observable signposts: data that would cause you to retain, upgrade, or downgrade the view.
For the medium term, do not simply extend a near-term growth rate in a straight line. The next 12 months are dominated by cyclical conditions such as energy prices, inflation, consumption, and interest rates. The next 5–10 years depend more on productive capacity: investment, infrastructure, skills, innovation diffusion, trade access, and policy credibility.
Chapter 1: Global Prospects and Policies; April 14, 2026
Return to the IMF report for its longer-horizon perspective. This is not a UK-specific 10-year forecast, but it gives a disciplined framework for thinking about the global conditions in which the UK will operate.
In “Medium-Term Outlook” on pp. 14–17, start with the medium-term warning. Continue through the discussion of fragmentation, investment, technology diffusion, and AI. Then read the short subsection “Sooner materialization of productivity gains from artificial intelligence” as an upside possibility, not as a baseline assumption.
The IMF’s medium-term message fits the structural diagnosis you built in the previous lesson. Geoeconomic fragmentation can reduce trade, migration, FDI, knowledge diffusion, and investment. At the same time, AI could raise productivity, but only where firms can adopt it effectively and where skills, digital infrastructure, organisational redesign, energy capacity, and competitive pressure support diffusion.
For the UK, the relevant long-term question is therefore not “Will AI save growth?” It is:
Will UK firms convert new technology, capital investment, and skilled labour into widespread productivity gains faster than trade frictions, infrastructure bottlenecks, weak investment, and policy uncertainty hold them back?
Your one-page UK economic outlook brief
The following is a compact version you can adapt. It separates sourced institutional forecasts from your own conditional judgement.
UK economic outlook — July 2026 evidence base
Current judgement
The UK enters the second half of 2026 with weak underlying momentum rather than an acute recession. The Bank of England estimates subdued activity, some spare capacity in the labour market, soft business confidence, and an expected near-term slowdown in business investment. The central macroeconomic tension is that weak demand should reduce domestic inflation pressure, while an energy shock can still raise headline inflation and risk becoming more persistent through wages and firms’ price setting.
What forecasters expect
The OBR’s March 2026 forecast places annual real GDP growth at about in 2026, rising to around in 2027–28 and in 2029–30. The IMF’s April forecast is weaker, at in 2026 and in 2027, because higher energy prices and slower monetary easing weigh on activity. The Bank of England’s July central projection, measured on a four-quarter rather than calendar-year basis, has GDP growth at in 2026 Q3 and 2027 Q3, strengthening to in 2028 Q3. It expects inflation to return close to the target by 2027, conditional on energy futures and only moderate second-round effects.
1–2 year conditional outlook
Central case: UK growth remains weak through 2026 and early 2027, then improves modestly as energy-price effects fade, inflation declines, and real-income growth recovers. This is broadly consistent with annual growth around in 2026 and a gradual recovery during 2027, not a rapid boom. Business investment remains a constraint because confidence and financing conditions are weak.
Downside case: A prolonged energy shock raises inflation expectations and wage or price persistence. The Bank of England must keep monetary policy tighter for longer, mortgage and corporate borrowing costs stay elevated, and household demand and business investment weaken further. Growth could undershoot institutional baselines even while inflation remains above target.
Upside case: Energy prices fall faster than assumed, inflation recedes without entrenched wage-price effects, and interest-rate expectations ease. Households reduce precautionary saving, while firms restart delayed investment. This would improve 2027 growth, though it would not by itself solve the productivity problem.
5–10 year conditional outlook
Structural baseline: Trend UK growth remains modest if business investment, infrastructure delivery, skills, management quality, and technology diffusion do not improve materially. Trade frictions and policy uncertainty continue to depress the expected return on long-lived investment. Higher employment alone cannot sustainably substitute for productivity growth.
Structural upside: Growth potential improves if private and public investment rise together, planning and infrastructure constraints ease, firms diffuse digital and AI-enabled practices beyond a small frontier, and policy stability supports investment and FDI. This is a productivity-led scenario, not simply a demand-led rebound.
Structural downside: Persistent underinvestment, skills shortages, geopolitical fragmentation, and higher funding costs produce a low-productivity equilibrium in which growth stays weak and the economy remains vulnerable to external shocks.
Signposts to monitor
| Indicator | Would support the central or upside case | Would challenge it and increase downside concern |
|---|---|---|
| Wholesale oil and gas prices | Sustained fall toward, or below, forecast futures paths | Persistent elevation or renewed large spikes |
| CPI inflation and inflation expectations | Energy-driven rise fades; medium-term expectations remain anchored | Broad-based inflation and expectations move higher |
| Regular pay growth and wage settlements | Pay growth moderates in line with the inflation target and spare capacity | 2027 settlements accelerate despite weak activity |
| Household demand | Consumption holds up as real incomes recover; saving rate declines gradually | Falling confidence, higher precautionary saving, weak retail and services demand |
| Business investment and credit conditions | Investment intentions and capital spending recover; financing spreads ease | Investment remains flat or falls as uncertainty and borrowing costs persist |
| Productivity and capital deepening | Output per hour, R&D, software investment, and AI adoption improve across ordinary firms | Growth comes mainly from additional labour while output per hour remains flat |
| Trade and FDI | Export participation and productive inward investment improve | Further trade barriers, falling FDI, or reduced access to specialised inputs and talent |
A final discipline matters here: these signposts should be read as a system, not as isolated dashboard tiles. A temporary fall in headline inflation is less reassuring if wage growth, inflation expectations, and firms’ price plans are rising. Equally, weak GDP growth is less alarming if it accompanies disinflation, easing financial conditions, and an early recovery in business investment.
You now have a complete outlook framework:
- the OBR provides a medium-term annual-growth baseline, with a March downgrade to 2026;
- the IMF provides a more cautious global and energy-sensitive near-term view;
- the Bank of England provides the clearest scenario logic around energy, inflation persistence, and monetary policy;
- your own outlook should remain conditional, anchored to observable indicators rather than a single growth number.
The central judgement is one of a UK economy with limited near-term momentum and meaningful inflation-risk uncertainty, alongside a longer-term growth problem rooted in weak productivity and investment. A stronger outcome is possible, but it requires more than cheaper energy or lower rates: it requires sustained improvement in the country’s capacity to invest, innovate, diffuse technology, and trade.
Can't find a good explanation? Sign up and we'll make it for you
Sign up