
Welcome. This compact course has two linked tasks: first, read the UK’s current economic conditions; then, turn that evidence into a conditional outlook rather than treating any forecast as destiny. This lesson begins the structural diagnosis: why has UK productivity growth been weak, and why do firms invest relatively cautiously?
By the end, you will have a defensible working ranking of three explanations for weak productivity and business investment: capital and infrastructure; skills and innovation; and trade frictions and policy uncertainty. The aim is not to find one culprit. It is to decide which explanations have the broadest, most direct, and most persistent evidence, while being explicit about uncertainty.
Treat the “productivity puzzle” as a diagnosis problem
Productivity is usually expressed as output per hour worked or output per worker. It matters because an economy cannot sustainably raise real incomes, profits, and the tax base merely by adding more hours or more people. It needs to produce more value with a given amount of labour.
A useful, deliberately simplified productivity-accounting lens is:
Here, is real output, is hours worked, is productive capital, and represents a broad set of efficiency effects: technology, skills, organisation, management, competition, and how effectively ideas spread between firms.
This equation is not a verdict on causation. If capital per worker is weak, that may be a cause of low productivity, a consequence of low expected growth, or both. Good economic reasoning keeps those possibilities separate.
For your outlook brief, assess each candidate explanation using four tests:
| Test | What you are asking |
|---|---|
| Reach | Does it plausibly affect many sectors, including services? |
| Direct mechanism | Can we explain how it changes firms’ costs, capacity, innovation, or output per hour? |
| Persistence | Does the evidence point to a long-running constraint rather than a temporary shock? |
| Causal confidence | Is there more than a correlation or an appealing story? What else could explain the result? |
This avoids a common failure mode in economic commentary: relabelling the problem as its explanation. “Productivity is weak because investment is weak” is incomplete until we ask why investment is weak, what kind of investment is missing, and whether it is the binding constraint.
How to improve productivity growth | UK Economy
Watch LSE’s “How to improve productivity growth | UK Economy” for a concise framing of the long-run investment diagnosis: skills, capital, R&D, Brexit-related trade barriers, and political instability.
Watch the core diagnosis. Focus on the mechanisms rather than treating this short account as a complete ranking: long-run capital formation, workforce capability, R&D, trade, and policy stability are presented as connected constraints.
The short video gives the overall hypothesis. The rest of this lesson tests and ranks its components.
Rank 1: capital formation and infrastructure
Working rank: first. Low capital formation is the most persuasive proximate explanation for weak UK productivity, because it is broad, persistent, and affects the capacity of firms across much of the economy. Infrastructure is part of this category because it changes the productivity of private investment: an efficient firm still loses time and opportunities if workers cannot reach it, digital connectivity is poor, or housing costs prevent people from living near productive jobs.
The long-run investment picture is striking.
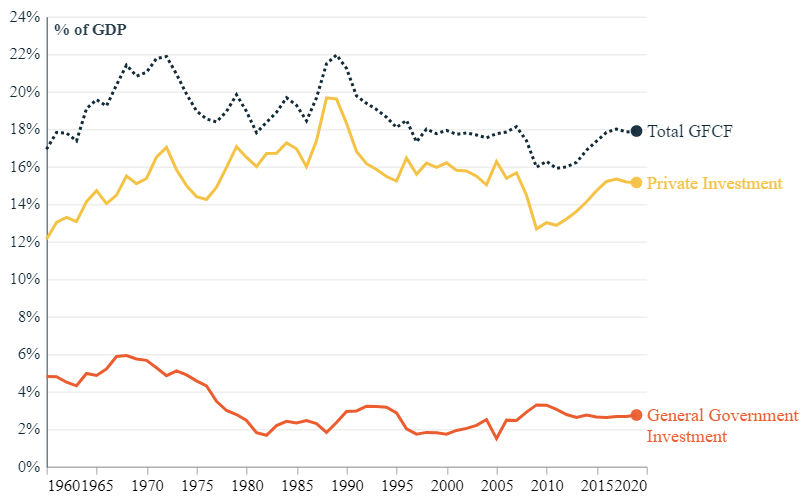
The figure supports three careful observations:
- Investment has not followed a smooth upward path. Total gross fixed capital formation was above 20% of GDP at points in the late 1960s and around 1990, but sits around 18% near the chart’s 2020 endpoint.
- Private investment does most of the moving. Its falls and recoveries account for much of the total pattern. That matters for the business-investment question, but it also means firms’ expectations, financing conditions, and uncertainty are central.
- Public investment is smaller and structurally lower than in the 1960s. It rose somewhat in the late 2000s but remains near 3% of GDP at the endpoint. Public capital can complement private capital through transport, energy networks, broadband, schools, and housing-related infrastructure.
Yet “investment” should not be reduced to factories and machines. The UK is predominantly a service economy. A productive design, education, software, health, professional-services, or creative business may need data systems, cloud capacity, product development, brand building, specialised knowledge, and trained people more than it needs a new production line.
That distinction matters for a product-led firm. A company can buy laptops and still fail to improve productivity if its staff lack the capability to use new systems, its processes are fragmented, or it cannot obtain patient funding to build an intangible asset whose payoff is years away. Conversely, investment in an effective operating model, proprietary software, research, and skilled teams may create durable capacity even when national accounts do not capture all of it as conventional fixed investment.
Productivity and Investment - March 2024
Read the National Institute of Economic and Social Research report selectively for its crucial distinction between physical and intangible investment, and for its account of why credible long-term public strategy affects private investment.
In Section 6.1, “What Counts as Investment?”, read the investment argument. Follow the shift from plant and machinery to software, skills, brands, organisational knowledge, and finance for firms without tangible collateral. Then move to Section 6.3, “A Project-Based Approach”. Read the strategy discussion. Focus on the claim that stable project pipelines, governance, and cross-government continuity can lower the political risk surrounding both public projects and complementary private investment.
Why this ranks first, with an important qualification
Capital deepening gives workers better tools, systems, and infrastructure. That has a direct route to higher output per hour. The evidence also spans infrastructure, business equipment, software, R&D, and firm finance, so the mechanism reaches far beyond manufacturing.
But it remains a proximate explanation. Businesses may invest less because expected sales are weak, credit is costly, skilled workers are unavailable, trade opportunities are less attractive, or rules may change. For the brief, phrase this carefully:
Weak capital formation is the strongest broad explanation for low productivity growth, but it is partly an outcome of deeper constraints in skills, demand, finance, trade, and policy credibility.
That sentence prevents the rank from becoming circular reasoning.
Rank 2: skills, innovation, management, and diffusion
Working rank: second. The UK’s challenge is not simply a shortage of university graduates or a lack of world-class research institutions. It is whether a broad base of firms can acquire relevant skills, adopt technology, improve management, and turn new knowledge into scalable products and processes.
This category combines four connected mechanisms:
- Basic and technical skills: weak numeracy, literacy, technical capacity, and shortages in particular occupations limit firms’ ability to adopt new methods.
- Lifelong learning: firms and workers may underinvest in retraining because benefits are uncertain, workers can change employer, and smaller firms have limited management capacity.
- Management and organisational capability: technology does not automatically produce productivity gains. Firms need good workflows, leadership, data use, and employee engagement to redesign work around it.
- Innovation diffusion: frontier firms may innovate, but aggregate productivity stays weak if most firms cannot identify, absorb, finance, or implement useful innovations.
The complementarity with capital is central. A new CRM, AI-enabled workflow, or manufacturing system delivers little if the organisation does not redesign decisions, train staff, and measure whether quality or throughput actually improves. Equally, better-trained workers can be constrained if they use outdated systems or face poor connectivity and long commutes.
A Review of Analysis and Policy Recommendations
Read the UK-specific passages in this international Productivity Commission review. They provide the evidence base for your ranking, while also warning against single-cause explanations.
First, find the United Kingdom passage immediately before Section 4.2, “Human capital, skills, management and attracting talent.” Read the investment evidence. Note the proposed channels: growth finance, tax and cost of capital, public investment, uncertainty, labour-market incentives, and infrastructure. In Section 4.2, read the UK subsection, the skills analysis. Distinguish education levels from the broader issues of training quality, reskilling, management, and matching skills to work. In Section 4.3, “R&D and innovation,” read the innovation passage. Pay particular attention to technology diffusion from leading firms to laggards and to business-university collaboration. Finally, read the UK passage immediately before Section 5.2, “Business environment, competition and regulation”: the trade and FDI analysis, followed by the governance analysis in Section 5.2.
Why it ranks below capital and infrastructure
Skills and innovation are plausibly fundamental: they shape the return firms expect from capital, and they help determine whether investment is used well. The evidence identifies specific UK weaknesses in training, STEM participation, managerial practice, technology diffusion, and collaboration.
The reason for ranking it second is not that it matters less. It is that the evidence base groups together several different problems with different timescales and causes. A basic-skills gap, weak in-work training, poor management, and slow diffusion of digital tools do not necessarily respond to the same policy. Their effects also take longer to measure than a fall in investment spending.
A strong brief should therefore avoid the vague recommendation “improve skills.” It should identify the mechanism: for example, in-work training and digital adoption among smaller firms, or technical training that directly supports local high-productivity sectors.
Rank 3: trade frictions and policy uncertainty
Working rank: third, but an important amplifier. Brexit-related trade frictions and domestic policy uncertainty have strong theoretical mechanisms and meaningful evidence, particularly for trade-exposed firms, smaller exporters, and inward investment. However, they explain less of the UK’s full, decades-long productivity weakness than the broader capital and capability problems above.
Trade can raise productivity through several routes:
- exporting firms gain access to larger markets and may achieve greater scale;
- international competition pressures firms to improve;
- firms acquire ideas, standards, specialised inputs, and partnerships through global value chains;
- foreign direct investment can bring capital, management practices, technology, and knowledge spillovers.
Brexit can increase the costs of each route through compliance requirements, rules of origin, regulatory divergence, reduced labour mobility, and friction at the border. These costs are not evenly distributed. Large firms are more likely to have legal, financial, and operational capacity to adapt; smaller firms may find a market no longer worth serving.
Policy uncertainty works differently. Investment in a factory, a transport network, an energy project, a new market, or a major digital platform is often hard to reverse. If taxation, planning, subsidies, trade rules, or net-zero policy may change before returns arrive, firms may delay, scale down, or demand a higher return before committing.
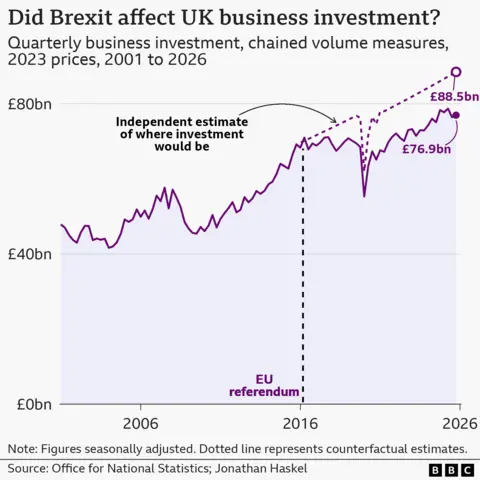
The visual is useful, but its dotted line is not observed data. It is a counterfactual estimate, based on assumptions about how investment would otherwise have evolved. The gap is consistent with Brexit having reduced investment, but it does not prove that Brexit alone caused the entire difference. Other shocks, including the pandemic, energy-price shocks, interest-rate changes, and global weakness, also affected decisions.
That is exactly the discipline your outlook brief needs: use such evidence as an estimate with a method and assumptions, not as a simple before-and-after proof.
Why it ranks third
Trade frictions and uncertainty are highly credible contributors to weak investment since the mid-2010s. They may also worsen the first two categories by reducing expected returns on capital and weakening access to talent, markets, finance, and foreign knowledge.
But UK productivity growth slowed after the global financial crisis, well before the 2016 referendum. And policy uncertainty is hard to quantify independently from the economic shocks that create it. The most defensible claim is:
Trade frictions and policy instability are significant recent headwinds and amplifiers of weak investment, especially for internationally exposed sectors. They are unlikely to be the sole explanation for the UK’s longer-run productivity slowdown.
Put the ranking into the outlook brief
Use this as the structural-diagnosis section of your one-page brief.
| Rank | Explanation | Evidence-led judgement | What would strengthen or weaken the judgement? |
|---|---|---|---|
| 1 | Capital formation and infrastructure | The broadest direct explanation. UK investment has been persistently modest relative to earlier domestic levels and international peers, while weak transport, housing, broadband, planning, and growth finance can constrain private-sector productivity. Include intangible investment, not only machinery. | Sustained growth in business investment, R&D, software, infrastructure delivery, and planning approvals would weaken the diagnosis. Continued weak capital deepening would strengthen it. |
| 2 | Skills, innovation, management, and diffusion | A likely deep constraint on how effectively capital is deployed. Weaknesses include basic and technical skills, in-work training, management quality, technology diffusion, and business-university links. | Better adult-training participation, stronger adoption of digital tools by ordinary firms, improved management practices, and broader R&D diffusion would challenge this rank. |
| 3 | Trade frictions and policy uncertainty | A material post-2016 headwind to trade, FDI, investment, and access to skills, particularly for smaller or trade-exposed firms. It amplifies other constraints but cannot fully explain the longer productivity slowdown. | Improved export participation, rising FDI in productive sectors, stable long-term policy frameworks, and a narrowing investment gap relative to counterfactual estimates would weaken the claim. |
A concise judgement paragraph could read:
Structural judgement: Weak UK productivity is best understood as a reinforcing system rather than a single failure. Persistently low physical and intangible capital formation, alongside infrastructure constraints, is the strongest direct explanation. Skills, management quality, innovation diffusion, and access to growth finance help determine whether investment produces productivity gains. Brexit-related trade frictions and unstable long-term policy have added a significant recent deterrent to investment and FDI, but mainly amplify rather than replace the underlying capital and capability challenge.
The phrase “reinforcing system” is doing important work. Weak skills lower the return on technology; weak infrastructure lowers the return on private investment; uncertainty delays both. Those delayed investments then leave the economy with less productive capacity, which can reduce confidence in future growth.
The key takeaway is not that the UK has a settled, universally proven hierarchy of causes. The evidence supports a practical ranking: capital and infrastructure first; skills and innovation second; trade frictions and policy uncertainty third as a powerful amplifier. Keep the distinction between observed patterns, plausible mechanisms, and causal proof visible in the brief.
In the next lesson, you will use this structural diagnosis to compare projections from institutions such as the OBR, Bank of England, and IMF or OECD, then build conditional outlooks for the next 1–2 years and the next 5–10 years.
Can't find a good explanation? Sign up and we'll make it for you
Sign up