Hello! Welcome back to our course on building a global e-commerce business.
In our last lesson, you learned the critical skill of implementing UTM parameters. You now know how to "tag" the traffic from your Google and TikTok ad campaigns. This was the setup phase—sending clean, identifiable data to your analytics tools. Now, it's time for the payoff: learning how to read that data to make smart business decisions.
This lesson directly addresses the learning outcome: Use Google Analytics to analyze which channels are driving traffic and sales to your products. We will connect the dots from the previous lesson and explore how to use Google Analytics 4 (GA4) to answer fundamental questions like:
- Which of my ad campaigns are actually generating revenue?
- Are visitors from TikTok more or less engaged than visitors from Google?
- Where are customers dropping off in my sales process?
Your IT background will be a significant asset here, as we'll be navigating a data-rich environment. The goal is not just to look at numbers but to interpret them to optimize your marketing spend and increase profitability.
1. Getting Started with Google Analytics 4 (GA4)
First, what is Google Analytics? It's a free, powerful web analytics service offered by Google that tracks and reports website traffic. For your e-commerce business, it’s the central hub where data from all your marketing channels—Google Ads, TikTok Ads, email, social media—comes together. By placing a small piece of code on your storefront (like Shopify), GA4 collects data on who visits, where they came from, and what they do.
To get a quick but solid introduction to what GA4 is and why it's essential for e-commerce, let's start with this video.
Google Analytics 4 (GA4) 2025 For Beginners - Everything You NEED To KNOW!
This video, 'Google Analytics 4 (GA4) 2025 For Beginners' by Brendan Gillen, provides a clear, high-level overview of what GA4 does and how it tracks user behavior and traffic sources.
Watch the first 1 minute and 30 seconds of the video (00:00 - 01:30). The presenter gives an excellent summary of what Google Analytics is and the kind of questions it helps you answer.
2. Finding Your Most Important E-commerce Reports
The GA4 interface can feel overwhelming at first. The key is to know which reports provide the most value for an e-commerce seller. We will focus on the Acquisition reports, which are specifically designed to show you where your users are coming from.
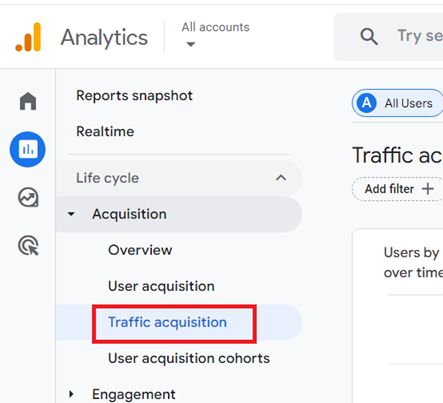
This report is your home base for analyzing channel performance. Let's watch another segment from the same video to see how to navigate to this report and begin making sense of it.
Google Analytics 4 (GA4) 2025 For Beginners - Everything You NEED To KNOW!
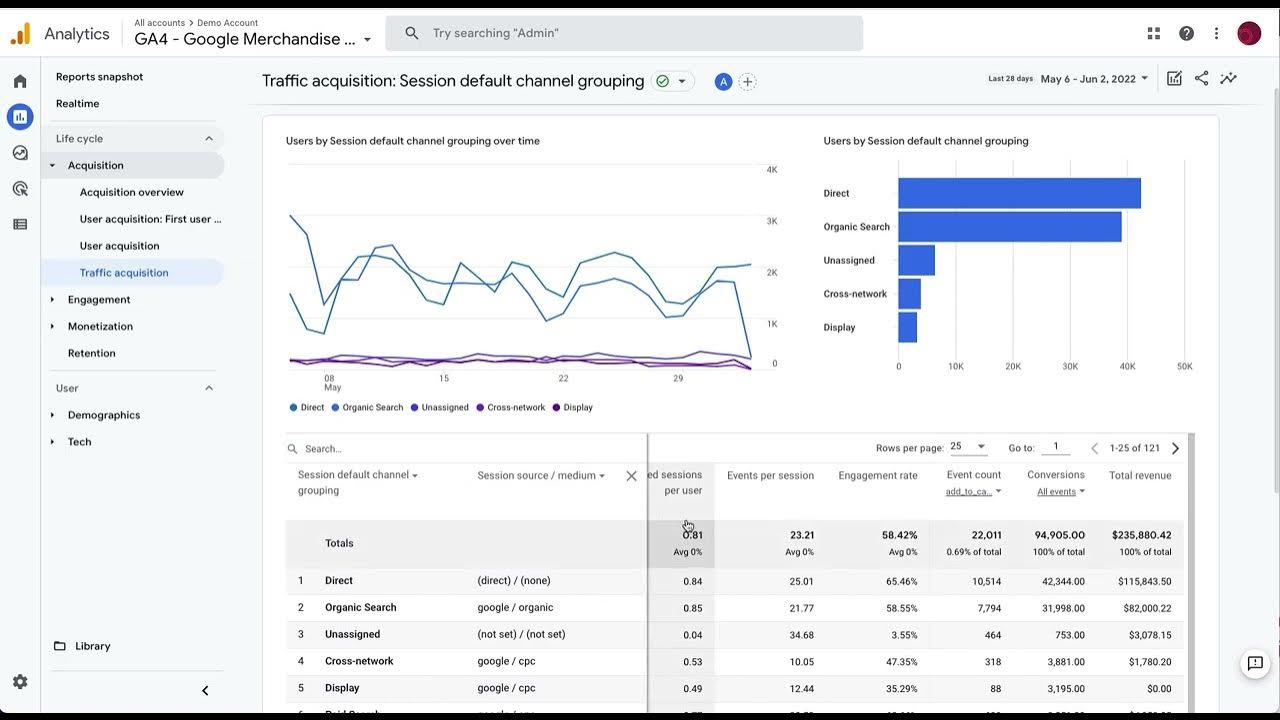
Continuing with the same 'GA4 for Beginners' video, this section will guide you through the GA4 interface and into the most critical report for our purpose: 'Traffic acquisition'.
Please watch from 01:30 to 07:38. Focus on: How to navigate the 'Reports' section and why the 'Lifecycle' collection is important for e-commerce. The difference between the default view ('Session default channel group') and the more granular 'Session source / medium' view, which uses your UTM data. The demonstration of how to customize the report to add crucial e-commerce metrics like Conversion rate and Total revenue.
Key Takeaways from the Video:
- Traffic Acquisition is Your Go-To Report: This is where you'll spend most of your time analyzing marketing performance. It directly answers "Which channels are driving traffic and sales?"
- Source / Medium is Granular: While the
Default Channel Grouping(e.g., "Paid Search," "Organic Social") is useful, changing the primary dimension toSession source / mediumgives you the specific data from your UTM tags (e.g.,google / cpc,tiktok / paid). This is how you connect your analysis directly back to your campaigns. - Customization is Key: Your default view might not show all the metrics you need. As shown in the video, you can and should customize the report to include columns for Total revenue and Conversion rate. This turns a simple traffic report into a powerful business analysis tool.
3. Understanding User vs. Traffic Acquisition
In GA4, you'll notice two very similar-sounding reports: User acquisition and Traffic acquisition. The difference is subtle but crucial for correct analysis.
- User Acquisition Report: Answers "How did this user first discover my site?" It focuses on the very first touchpoint and uses a "first-click" attribution model. This is useful for understanding how you acquire new customers over their lifetime.
- Traffic Acquisition Report: Answers "What channel brought the user to my site for this specific session?" It focuses on the most recent touchpoint and uses a "last-click" attribution model. This is more useful for evaluating the immediate effectiveness of a specific ad or campaign.
For day-to-day performance marketing analysis (e.g., "Did my TikTok ad from yesterday drive sales?"), you will primarily use the Traffic Acquisition report.
To solidify this concept, please read the following section from an excellent guide by AnalyticsMania.
A Guide to Acquisition Reports in Google Analytics 4 (2026)
This article, 'A Guide to Acquisition Reports in Google Analytics 4', provides a very clear explanation of the difference between User and Traffic acquisition.
Please read the section titled 'User Acquisition vs Traffic Acquisition'. The diagrams and comparison table in this section make the distinction very clear.
4. Analyzing the Full Customer Journey
Knowing which channel brought a user to your site is only half the story. You also need to know what they did once they arrived. GA4 has other standard reports that help you visualize this.
Landing Page Report
This report shows you the very first page a user saw during their session. It helps you answer questions like: "Is the product page I'm sending ad traffic to engaging enough?" or "Are users immediately leaving after landing on my page?"
You can find this report under Reports > Engagement > Landing page. By sorting this report by revenue or conversion rate, you can quickly identify your most effective entry points.
E-commerce Purchase Journey
This report visualizes your sales funnel, showing how many users move from one step to the next: from starting a session, to viewing a product, adding to cart, beginning checkout, and finally purchasing. It's invaluable for identifying bottlenecks in your conversion process.
Let's watch a final clip that covers these two reports.
Google Analytics 4 (GA4) 2025 For Beginners - Everything You NEED To KNOW!
This segment from the 'GA4 for Beginners' video demonstrates how to use the Engagement and Monetization reports to analyze what users do after they arrive on your site.
Watch from 07:38 to 13:47. Pay close attention to: How to analyze the 'Pages and screens' and 'Landing pages' reports to understand user engagement. How to interpret the 'Purchase Journey' report to find where users are dropping off in the funnel (e.g., high drop-off between 'add to cart' and 'begin checkout').
Test your understanding!
You are looking at your Traffic Acquisition report in GA4, filtered to show Session source / medium. You see the following two lines of data:
| Session source / medium | Sessions | Engaged sessions | Conversions | Total revenue |
|---|---|---|---|---|
| google / cpc | 1,500 | 900 | 45 | $2,250 |
| tiktok / paid | 3,000 | 600 | 30 | $1,200 |
Based only on this data:
- Which channel is better at driving revenue per conversion?
- Which channel's audience is more engaged after clicking the ad?
- If your goal was to maximize revenue, which channel seems more effective right now?
Show answer
-
Revenue per conversion:
- Google: $2,250 / 45 conversions = $50 per conversion.
- TikTok: $1,200 / 30 conversions = $40 per conversion.
- Answer: Google/cpc is better at driving revenue per conversion.
-
Engagement:
- Google: 900 Engaged sessions / 1,500 Sessions = 60% engagement rate.
- TikTok: 600 Engaged sessions / 3,000 Sessions = 20% engagement rate.
- Answer: The audience from Google/cpc is significantly more engaged.
-
Revenue Effectiveness:
- Answer: Google/cpc is the more effective channel for driving revenue, bringing in nearly double the revenue with half the sessions. This suggests the traffic quality from Google is much higher in this scenario.
5. For Deeper Analysis: An Introduction to Explorations
Standard reports are powerful, but sometimes you have a specific question they can't answer. For this, GA4 has a tool called Explorations. This is an advanced report builder that lets you create fully custom reports from scratch using a drag-and-drop interface.
Given your technical background, this is a feature you will likely find very powerful once you are comfortable with the basics. You can build custom funnels, compare user segments, and visualize data in ways that standard reports don't allow.
We won't build an Exploration today, but it's important to know it exists for when you need to dig deeper.
GA4 Explorations for Ecommerce: A Complete Guide
This 'GA4 Explorations for Ecommerce' guide from Littledata offers a great introduction to what Explorations are and why they are so powerful.
Please read the first two sections: 'What are GA4 Explorations?' and 'How to use GA4 explorations'. This will give you a conceptual understanding of the tool and its interface.
Conclusion
You have now closed the loop on paid ad tracking. You started by learning how to tag your ad traffic with UTMs, and today you've learned how to read that data in Google Analytics to measure performance. This process is the engine of data-driven marketing for any e-commerce business.
Key Takeaways:
- The Traffic Acquisition Report is Central: Use this report with the
Session source / mediumdimension to see how your campaigns (tagged with UTMs) are performing in terms of traffic, conversions, and revenue. - Customize Your Reports: Add essential e-commerce metrics like
Total revenueandSession conversion rateto your reports to get a full picture of performance. - Analyze the Full Funnel: Go beyond traffic sources. Use the
Landing pagereport to check entry-point performance and thePurchase Journeyreport to find and fix leaks in your sales funnel. - Explorations Offer Power: When standard reports aren't enough,
Explorationsprovide the flexibility to answer almost any custom question about your user data.
Next Up:
You are now equipped to measure the performance of the traffic you drive yourself. But what about getting others to drive traffic for you? In our next module, we will explore how to build and scale your business through partnerships. The first lesson will focus on how to design a competitive affiliate program structure, including setting commission rates and cookie durations, to recruit an army of partners who can promote your products.