Introduction
Welcome to the first lesson of our module on production inference frameworks. In the last module, we concluded by designing an optimal parallelism strategy for a 70B model on paper. You reasoned from first principles about memory, communication overhead, and compute efficiency. Now, it's time to bridge that theory with practice.
This lesson marks our transition from designing systems to evaluating real-world tools. We will start with vLLM, one of the most popular and performant open-source libraries for LLM inference serving. Your goal is to deploy a 7B model using vLLM and benchmark its throughput, latency, and GPU utilization.
By the end of this lesson, you will have set up a live inference server, subjected it to a benchmark load, and analyzed the resulting performance metrics. This hands-on experience will provide a concrete foundation for understanding why frameworks like vLLM are critical for building efficient, scalable AI systems.
The "Why" Behind vLLM's Performance
Before we start deploying, let's understand what makes vLLM so effective. At its core, vLLM solves a fundamental problem in LLM serving: massive memory waste. During autoregressive decoding, the KV cache for each sequence in a batch grows at every step. Naive systems pre-allocate a large, contiguous memory block for each sequence to accommodate its maximum possible length. This leads to significant waste through fragmentation and reservation, as most sequences don't reach the maximum length.
vLLM's key innovation, PagedAttention, addresses this head-on by applying a concept you'll find familiar from operating systems: virtual memory and paging.
To get a clear visual and conceptual understanding of this, please watch the following video from Anyscale, the creators of vLLM.
Fast LLM Serving with vLLM and PagedAttention
This video, 'Fast LLM Serving with vLLM and PagedAttention', explains the memory challenges in LLM serving and how PagedAttention solves them. It's the best resource for grasping the core idea.
Please watch the segments from 02:07 to 11:00. Pay close attention to: The recap of the KV cache and its dynamic nature (02:07 - 03:57). The explanation of the three types of memory waste in traditional systems (04:41 - 06:02). The core analogy to OS paging (06:02 - 07:03). The mechanics of how PagedAttention uses non-contiguous memory blocks (07:03 - 09:37). The analysis of how this minimizes fragmentation and boosts memory utilization (09:54 - 11:00).
As the video explains, by dividing the KV cache into non-contiguous blocks (pages) and managing them with a block table (page table), vLLM can:
- Eliminate internal fragmentation: Memory is allocated on demand, one block at a time.
- Eliminate external fragmentation: All blocks are the same size.
- Enable advanced memory sharing: The same physical token blocks can be mapped to multiple logical sequences, enabling efficient prefix caching and other optimizations.
This drastic improvement in memory efficiency allows vLLM to fit much larger batches into the same amount of VRAM. A larger batch size directly translates to higher GPU utilization and, consequently, higher throughput (tokens/second).
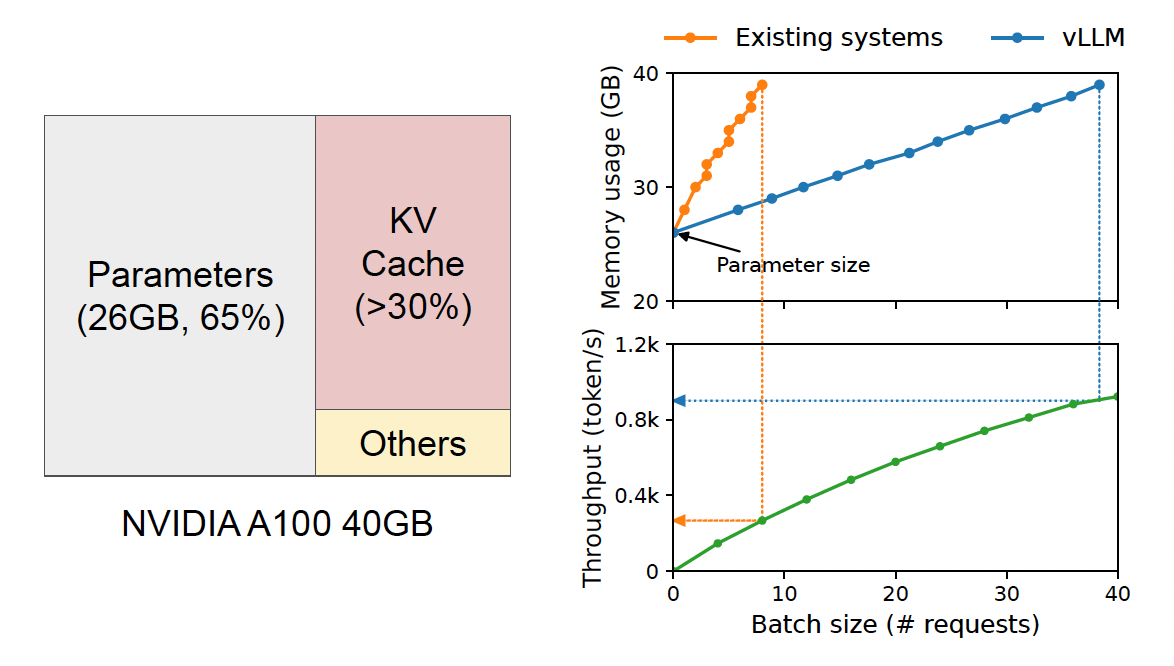
This efficient memory management is paired with continuous batching. Instead of waiting for all sequences in a static batch to finish, vLLM's scheduler can add new requests to the batch as soon as others complete, ensuring the GPU is almost never idle. This combination is what delivers its state-of-the-art performance.
Hands-On: Deploying a 7B Model with vLLM
Now, let's get our hands dirty. We will deploy a ~7B parameter model, meta-llama/Llama-3-8B-Instruct, using vLLM's OpenAI-compatible server. The process is remarkably straightforward.
The following guide provides a clean, step-by-step walkthrough. We'll follow its core commands.
How to Benchmark An LLM with vLLM in 10 Minutes
The article 'How to Benchmark An LLM with vLLM in 10 Minutes' from Vast.ai provides a concise, practical guide that we will use to deploy and test our server.
Read through steps 1 to 4. We will execute these steps together. You don't need to read about benchmarking yet; we will cover that next.
Let's proceed with the setup.
1. Install vLLM
Assuming you have a Python environment with PyTorch and CUDA set up, install vLLM using pip:
pip install vllm
2. Log in to Hugging Face (If needed)
The Llama 3 model is gated. You'll need to request access on its Hugging Face model card and then authenticate your machine.
huggingface-cli login
You will be prompted to paste an access token from your Hugging Face account settings.
3. Launch the vLLM Server
This single command is all it takes to download the model (if not cached) and start the inference server. It will automatically use your available GPU(s).
vllm serve meta-llama/Llama-3-8B-Instruct
You should see log output indicating that the server has started, likely with Uvicorn, on http://localhost:8000. The server exposes an API that is compatible with OpenAI's standards, which has become a de facto industry practice.
4. Test the Server
Open a new terminal and send a curl request to the completions endpoint to verify that the server is running and responsive.
curl http://localhost:8000/v1/chat/completions \
    -H "Content-Type: application/json" \
    -d '{
        "model": "meta-llama/Llama-3-8B-Instruct",
        "messages": [
            {"role": "user", "content": "Explain the concept of PagedAttention in one sentence."}
        ]
    }'
You should receive a JSON response containing the model's generated answer. With the server running, we are now ready to benchmark its performance.
Benchmarking Performance
To evaluate our deployment, we need to measure three key aspects: latency, throughput, and GPU utilization. vLLM provides a powerful built-in CLI tool for this.
The official vLLM documentation is the best resource for understanding the benchmarking tool's capabilities.
The vLLM 'Benchmark CLI' documentation explains how to run online and offline benchmarks and how to interpret the results.
First, review the 'Online Benchmark' section. This is what we will be doing. Pay close attention to the example command and the breakdown of the output metrics. Then, skim the 'Load Pattern Configuration' section to see the advanced options available for simulating realistic traffic, such as --request-rate. We'll use a simple configuration for now, but it's important to know these exist.
Running the Benchmark
We will use the vllm bench serve command to send a synthetic workload to our running server. For this test, we'll simulate 200 concurrent users sending requests as fast as possible.
Keep the server from the previous step running. In a new terminal, execute the following command.
vllm bench serve \
    --backend vllm \
    --model meta-llama/Llama-3-8B-Instruct \
    --endpoint /v1/completions \
    --dataset-name random \
    --random-input-len 512 \
    --random-output-len 512 \
    --num-prompts 500 \
    --request-rate inf \
    --max-concurrency 200
Let's break down these arguments:
--backend vllmand--endpoint: Specifies we're hitting a vLLM server at its completions endpoint.--dataset-name random: We're using randomly generated prompts.--random-input-lenand--random-output-len: Defines the size of our prompts and desired generations.--num-prompts 500: The total number of requests to send.--request-rate inf --max-concurrency 200: This is a key load pattern. It tells the benchmark to send requests with no delay (inf) but to never have more than 200 requests in flight at once. This simulates a system under heavy load, bounded by a concurrency limiter (like a load balancer).
Measuring GPU Utilization
While the benchmark is running, open a third terminal and monitor your GPU's activity. The nvidia-smi dmon command is excellent for this, providing a scrolling view of key metrics.
nvidia-smi dmon -s um
Look for two columns in particular:
gputil: GPU Utilization (in %). This shows how busy the GPU's compute cores are.memutil: Memory Utilization (in %). This shows how much of the GPU's VRAM is being used.
You should observe that once the benchmark ramps up, GPU utilization stays consistently high (ideally >90%). This is a direct visual confirmation of vLLM's efficiency. Continuous batching keeps the GPU fed with work, avoiding the idle periods that plague less sophisticated serving systems.
Interpreting the Results
After the benchmark completes, it will print a summary table. It will look something like this:
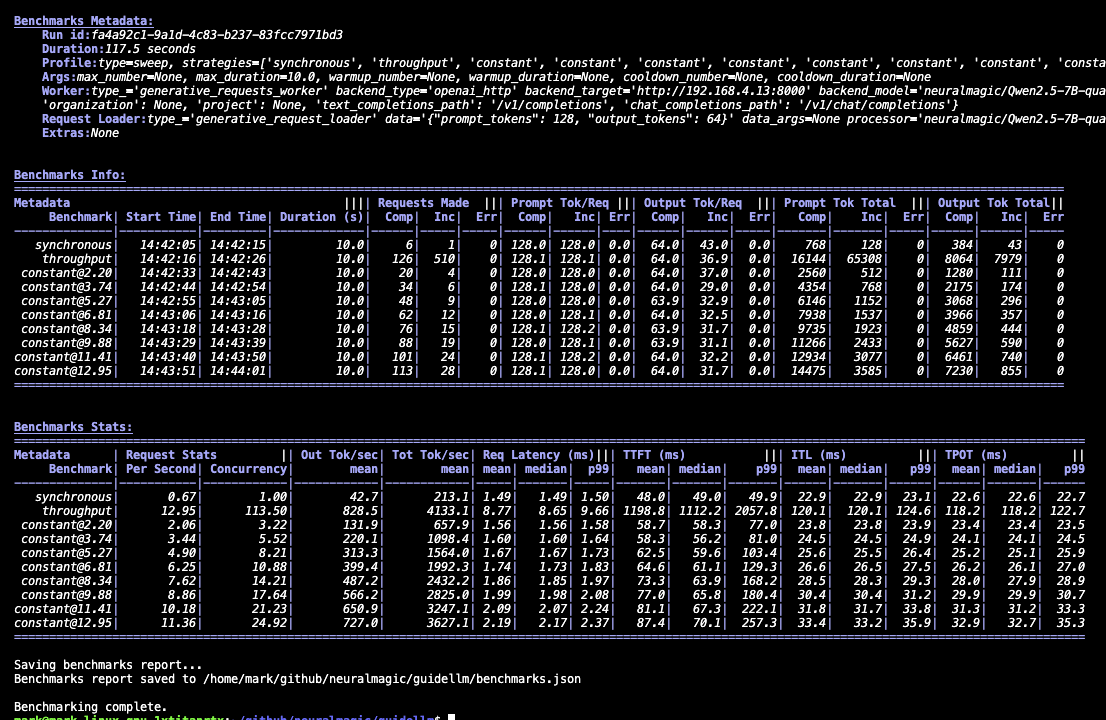
Let's focus on the most important metrics from your output:
- Request throughput (req/s): How many requests the system completed per second.
- Output token throughput (tok/s): This is often the most critical metric for cost. It measures the total number of output tokens generated per second across all concurrent requests. This is the "money" metric, as it represents the actual generative work being done.
- Time to First Token (TTFT): The average time from when a request is sent until the first token is generated. This is critical for user-perceived latency in interactive applications.
- Inter-token Latency (ITL) / Time per Output Token (TPOT): The average time between subsequent tokens in a generation. A low ITL means a smooth, fast streaming experience for the user.
By analyzing these numbers, you get a full picture of the server's performance. The high throughput is a direct result of PagedAttention and continuous batching, which we confirmed visually with the high, sustained GPU utilization.
Conclusion
In this lesson, you successfully deployed and benchmarked a 7B model using vLLM. You've moved from theoretical design to hands-on performance analysis, a critical skill for an AI Systems Engineer.
Key Takeaways:
- vLLM's Power Source: The core innovation is PagedAttention, which borrows concepts from OS virtual memory to drastically improve KV cache memory efficiency.
- Efficiency in Action: Better memory management allows for larger, dynamic batches via continuous batching, which in turn leads to high, sustained GPU utilization and state-of-the-art throughput.
- Benchmarking is Key: Using tools like
vllm benchandnvidia-smi, you can measure critical performance indicators: throughput (req/s, tok/s), latency (TTFT, ITL), and resource utilization. - Simple Deployment, Complex Internals: vLLM provides a very simple user interface (
vllm serve) that abstracts away its sophisticated internal scheduling and memory management systems.
Preview of the Next Lesson:
While vLLM is a dominant force in high-throughput serving, it's not the only player. Other frameworks optimize for different goals. In our next lesson, we will deploy the same model using SGLang, a framework designed for complex, multi-stage generation tasks and enhanced programmability. You will benchmark its performance against vLLM's and begin to build a mental model for when to choose one framework over the other.