
Hello! Welcome to the first lesson in our module on Database Performance & Optimization.
In our last lesson, we explored the trade-offs between Eloquent, the Query Builder, and raw SQL. A recurring theme was performance. We saw that for certain tasks, some tools are faster than others. But that discussion raised a crucial question: how do you prove a query is slow, and more importantly, how do you discover why it's slow?
This lesson answers that question. Our goal is to analyze MSSQL query performance using execution plans to identify bottlenecks. An execution plan is a roadmap that shows exactly how the SQL Server database engine intends to retrieve the data for your query. Learning to read this map is the single most important skill for diagnosing and fixing performance problems.
By the end of this lesson, you will be able to look at a slow query, generate its execution plan, and pinpoint the exact operations that are causing the delay.
1. What is an Execution Plan?
Before you run a query, the database's query optimizer analyzes it and determines the most efficient way to get the data. It considers things like available indexes, table sizes, and data distribution statistics. The result of this analysis is an execution plan.
Think of it like planning a road trip. You enter a destination into your GPS (you write a SQL query). The GPS then calculates the best route based on traffic, road closures, and speed limits (the query optimizer builds a plan). The final turn-by-turn directions are the execution plan. Just as a strange route from your GPS might reveal a hidden traffic jam, an execution plan reveals hidden performance bottlenecks in your query.
Let's start with a high-level overview of what an execution plan is and why it's so fundamental to optimization.
SQL Execution Plans (Visually Explained) | SQL Hints | #SQL Course 40
This video from the Data with Baraa channel provides an excellent introduction to the concept of execution plans. It explains their purpose and how the database engine uses them.
Watch from the beginning to 03:18. Focus on understanding: Why an execution plan is necessary for finding the 'pain point' in a slow query. The analogy of the plan being a 'window' into how the database thinks. The concept of the plan cache, where the database stores and reuses plans for similar queries.
2. Generating and Reading Your First Plan
To start analyzing queries, you first need to know how to get an execution plan. In SQL Server Management Studio (SSMS), you can generate a few different types.
- Estimated Plan: A guess at what the plan will be, without actually running the query.
- Actual Plan: The plan that was actually used to run the query. This is the most useful for troubleshooting because it contains real-world runtime information.
- Live Query Statistics: A real-time view of the plan as the query is executing. Useful for very long-running queries.
For most of your work, you will use the Actual Execution Plan.
SQL Execution Plans (Visually Explained) | SQL Hints | #SQL Course 40
Let's see how to generate these plans in SSMS. The same video from Data with Baraa demonstrates this clearly.
Watch the segment from 04:48 to 07:23. This will show you exactly where to click in the SSMS toolbar to include the Actual Execution Plan with your query results.
Once you run a query with the "Include Actual Execution Plan" option enabled, a new tab will appear in the results pane showing the graphical plan.
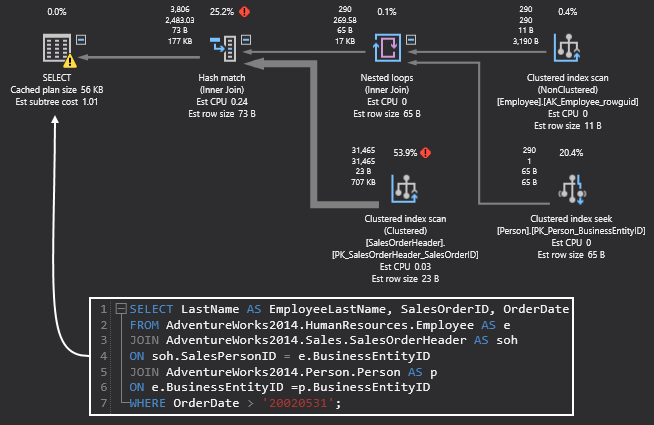
Now, how do you read this?
How To Read SQL Server Execution Plans
The layout can seem intimidating at first, but there are simple rules to follow. This video from Bert Wagner gives a quick and clear guide on how to navigate a plan.
Watch from 00:15 to 02:12. Pay close attention to: The reading direction: right to left, top to bottom. The meaning of the icons (operators) and arrows (data flow). How the thickness of the arrows indicates the number of rows being processed.
The key takeaway is that data flows from the data-retrieval operations on the right towards the final SELECT operator on the left. A thick arrow means many rows are being passed between operators, which is an immediate visual cue that a large amount of data is being processed at that stage.
3. Key Patterns That Signal Bottlenecks
You don't need to understand every single operator to be effective. Most performance problems can be identified by looking for a few common, high-impact patterns.
How to Read SQL Server Execution Plans: 7 Things That Matter
This article, 'How to Read SQL Server Execution Plans: 7 Things That Matter', is an excellent, practical guide that we will use as a framework for identifying bottlenecks.
Read the sections from "Getting Your First Execution Plan" through to the end of "7. Percentages Lie". We will break down each of these key patterns.
Let's walk through the most critical patterns from the article, supplemented with video examples.
Pattern 1: Scans vs. Seeks
This is the most fundamental concept in plan analysis.
- Scan: The database reads an entire table or index. This is like reading a book from cover to cover to find one piece of information.
- Seek: The database uses an index to go directly to the rows it needs. This is like using the book's index to jump to the correct page.
For large tables, a Scan is often a major performance killer. You almost always want to see a Seek.
SQL Execution Plans (Visually Explained) | SQL Hints | #SQL Course 40
Let's see the dramatic difference between a scan and a seek in action.
Watch two segments from the Data with Baraa video: 07:23 - 09:14: See what a Table Scan and Clustered Index Scan look like on a table. Notice it has to read all the rows. 13:38 - 15:36: After an index is created, watch the plan change to a much more efficient Index Seek. Notice the huge drop in 'Number of Rows Read'.
If you see a Table Scan or Clustered Index Scan on a large table where you are filtering for a small number of rows (e.g., WHERE CustomerID = 123), it's a huge red flag that you are missing an appropriate index.
Pattern 2: Estimated vs. Actual Rows
When you hover over an operator or an arrow, SSMS shows you a tooltip with details. One of the most important comparisons is Actual Number of Rows vs. Estimated Number of Rows.
If these numbers are wildly different, it means the query optimizer made a bad decision because its information was wrong. This is usually due to out-of-date statistics.

What to do: If you see a major discrepancy, the typical fix is to update the statistics on the table, which gives the optimizer better information for its next decision. The command is UPDATE STATISTICS YourTableName;.
Pattern 3: Costly Operators (Lookups and Sorts)
Besides scans, two other operators often signal trouble:
- Key Lookup / RID Lookup: You'll often see this paired with an
Index Seek. It means the index seek found the data in a non-clustered index, but then had to do an extra trip back to the main table to get other columns requested in yourSELECTlist. A few lookups are fine, but thousands or millions can destroy performance. The fix is often toINCLUDEthe missing columns in your non-clustered index. - Sort: This operator means SQL Server had to sort your data in memory because it wasn't already in the right order (e.g., for an
ORDER BYor aMERGE JOIN). Sorting large datasets is expensive in terms of both CPU and memory. The fix is often to create an index on the column(s) you are sorting by.
Pattern 4: Warnings (Yellow Triangles)
Sometimes, an operator will have a small yellow triangle with an exclamation mark. Never ignore these. This is the query optimizer telling you something is wrong.
How To Read SQL Server Execution Plans
The Bert Wagner video we saw earlier has a great segment on these warnings.
Watch from 04:10 to 05:09. Note the examples of warnings he gives, such as spilling to TempDB and implicit conversions.
One of the most common warnings for developers is Implicit Conversion. This happens when you compare columns of different data types (e.g., a VARCHAR column to an NVARCHAR parameter from your application). This forces SQL Server to convert the data on every single row, which prevents it from using an index and often leads to a slow scan.
4. Beyond the Visuals: Getting Hard Numbers
While the visual plan is great for identifying the type of problem, it's also crucial to get concrete metrics. The cost percentages shown on the plan are only estimates and can be misleading.
A more reliable way to measure the actual work done is to look at Logical Reads. This is the number of 8KB data pages SQL Server had to read from memory (the buffer cache) to satisfy your query. Fewer logical reads is almost always better.
You can get this information using a simple command in SSMS.
SQL SERVER - Execution Plans and Indexing Strategies
This article from SQL Authority provides scripts to measure performance. We'll focus on the commands for enabling I/O and time statistics.
Read the sections "Understanding the Performance Tuning Landscape" and "Observing Baseline Performance". Pay close attention to the SET STATISTICS IO ON; and SET STATISTICS TIME ON; commands. Notice how the author uses the 'logical reads' output to establish a performance baseline.
By running these SET commands before your query, you can check the "Messages" tab in SSMS to see the exact number of logical reads, CPU time, and elapsed time. This allows you to quantify your improvements. For example, before adding an index, you might see 50,000 logical reads. After, you might see 50. This is concrete proof of optimization.
Conclusion
You now have the foundational knowledge to start diagnosing query performance in MSSQL. This is an essential skill that separates junior developers from senior-level engineers who can build scalable, high-performance applications.
Key Takeaways:
- An execution plan is the database's roadmap for running your query.
- Always use the Actual Execution Plan for the most accurate diagnosis.
- Read plans from right to left. Thick arrows indicate large amounts of data.
- Look for major red flags:
- Scans (Table or Clustered Index) on large tables instead of Seeks.
- Key Lookups that are executed many times.
- Expensive Sort operators.
- Warnings (yellow triangles), especially for implicit conversions.
- Large discrepancies between Estimated and Actual row counts.
- Use
SET STATISTICS IO ONto measure the real cost of a query in logical reads.
Up Next:
In this lesson, you've learned how to identify the bottlenecks. In our next lesson, "Create and manage clustered and non-clustered indexes to optimize query speed," you will learn how to fix them. We will dive deep into creating the right indexes to turn those costly scans into lightning-fast seeks.