
Hello! Welcome to the third module of your course, where we shift our focus from general principles to specific organ systems.
In our last lesson, we covered the critical and very practical techniques for applying electrodes to get a clean signal. We learned that without a good connection at the skin, all subsequent instrumentation is compromised. Now that we know how to acquire a high-quality signal, we can begin to explore what these signals mean, starting with the heart.
This lesson addresses the learning outcome: Describe the heart's electrical conduction system and its relation to the cardiac cycle. We will explore the heart's intrinsic "circuitry"—a specialized network of cells that generate and distribute electrical impulses—and see how this electrical activity orchestrates the heart's mechanical pumping action.
This is the physiological foundation of the electrocardiogram (ECG) and is highly relevant to your work at Neuraease. The R-peaks of the ECG, which are used to calculate Heart Rate Variability (HRV), are a direct result of the electrical events we'll study today. Understanding this system is the first step toward interpreting markers of autonomic nervous system function like HRV.
The Heart's "Clock" and "Wiring": The Conduction System
For the heart to pump blood effectively, its four chambers must contract in a highly coordinated sequence. This coordination is managed by an intrinsic electrical system. From your ECE background, you can think of this as a built-in clock generator (a pacemaker) connected to a precisely timed signal distribution network.
The main components of this system are:
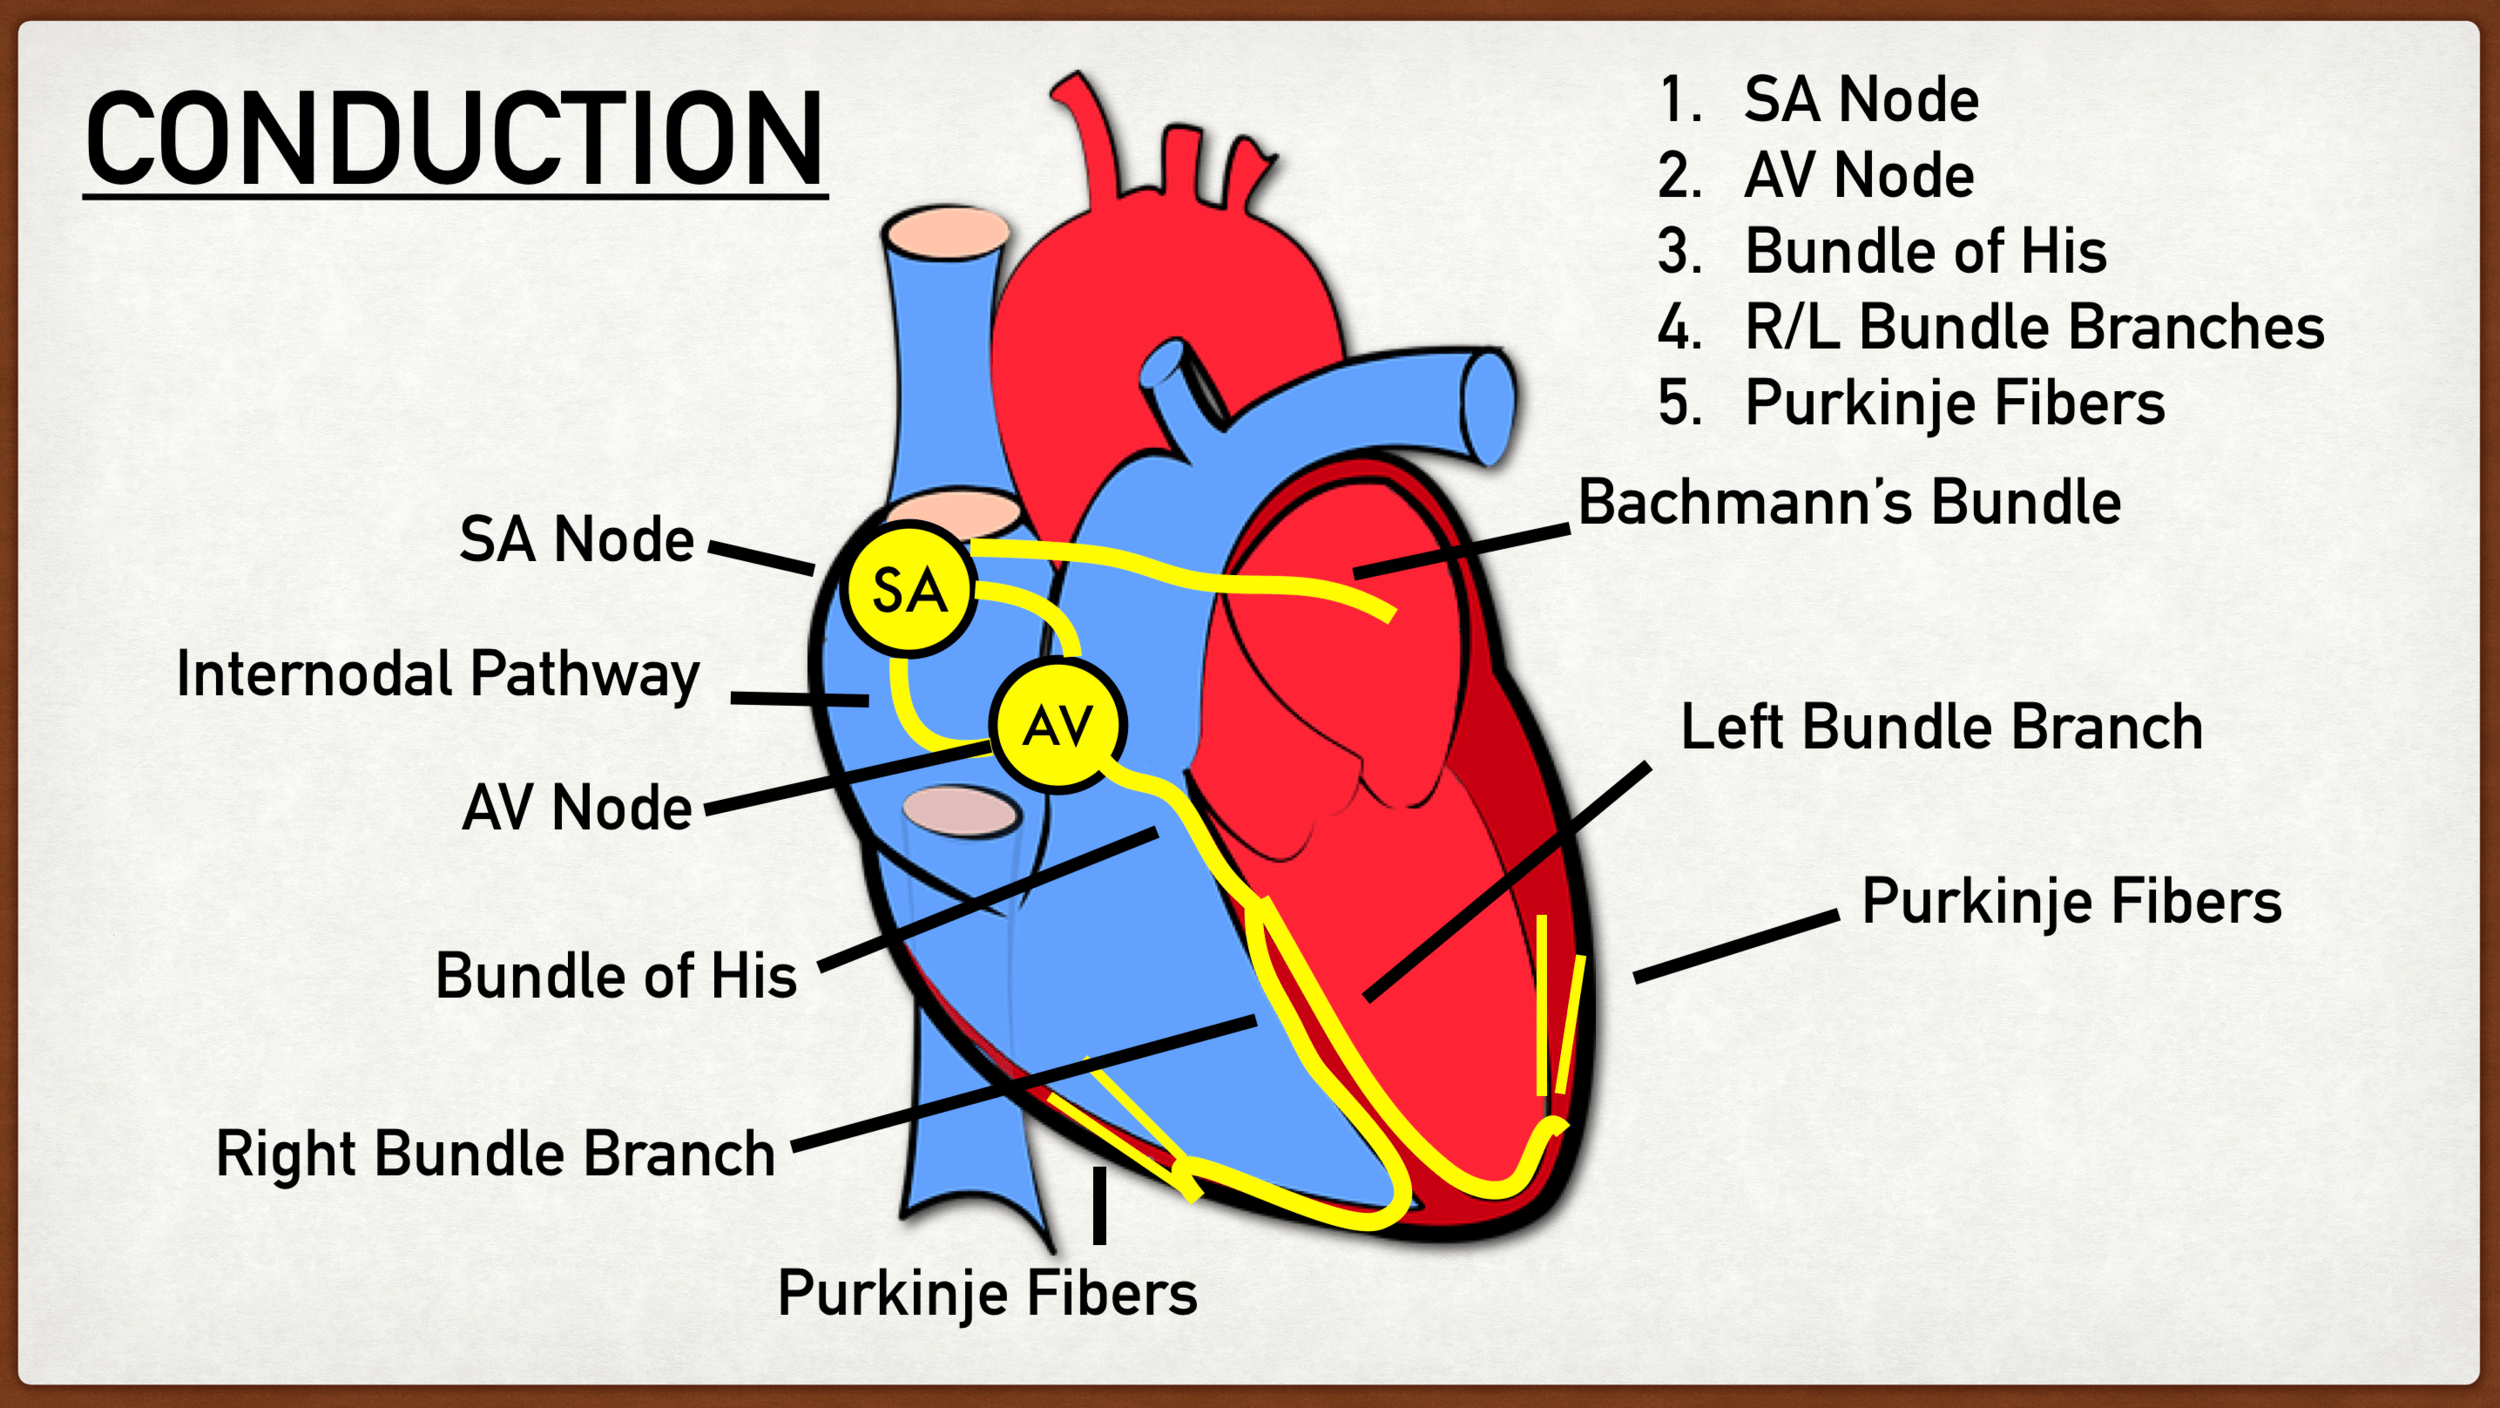
- Sinoatrial (SA) Node: The primary pacemaker. It spontaneously generates electrical impulses at a regular rate, initiating the heartbeat.
- Atrioventricular (AV) Node: A critical "delay gate." It briefly slows the electrical signal, giving the atria time to finish contracting before the ventricles start.
- Bundle of His, Bundle Branches, and Purkinje Fibers: A high-speed distribution network that rapidly spreads the electrical signal throughout the ventricles, ensuring they contract in a powerful, coordinated way from the bottom up.
This diagram shows the physical layout of these components within the heart.
To see how these components work together dynamically, let's watch a short animation.
Cardiac Conduction System and Understanding ECG, Animation.
The video 'Cardiac Conduction System and Understanding ECG, Animation' by Alila Medical Media provides a clear, animated overview of the path of electrical conduction.
Please watch the first part of the video, from the beginning to 01:24. Focus on the sequence of activation: SA node -> atria -> AV node -> bundle branches -> Purkinje fibers.
This sequence ensures that the atria contract first, pushing blood into the ventricles, and then the ventricles contract to pump blood out to the lungs and the rest of the body. The delay introduced by the AV node is crucial for this timing. Without it, the atria and ventricles would contract nearly simultaneously, making the pump action highly inefficient.
For a detailed textual description of each component's function, the following resource is excellent.
10.4: Cardiac Cycle and Electrical Activity
The online textbook 'Cardiac Cycle and Electrical Activity' from LibreTexts offers a comprehensive written explanation of the conduction system.
I recommend reading the section titled 'Conduction System of the Heart'. It provides a great breakdown of the role of each part, from the SA node to the Purkinje fibers, and includes the timing of the impulse propagation (e.g., the ~100 ms delay at the AV node).
Translating Electrical Events into an ECG
The electrocardiogram (ECG) is a recording of the collective electrical activity of the heart measured on the body's surface. Each wave and segment on an ECG trace corresponds to a specific event in the conduction sequence.
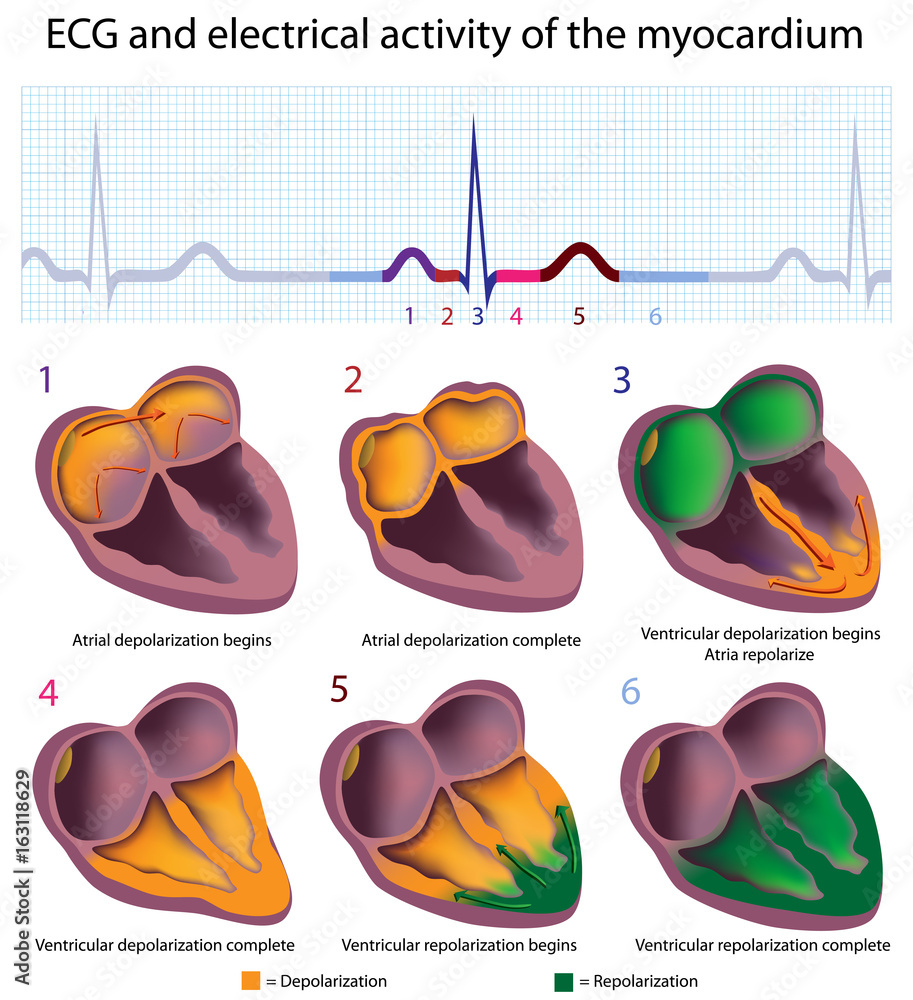
Here is the breakdown:
- P wave: Represents the depolarization of the atria, initiated by the SA node. The atria begin to contract shortly after the P wave begins.
- PR Interval: The time from the start of the P wave to the start of the QRS complex. It represents the time it takes for the impulse to travel from the SA node, through the atria, and—most importantly—to be delayed at the AV node.
- QRS Complex: Represents the rapid depolarization of the ventricles as the impulse spreads through the bundle branches and Purkinje fibers. Because the ventricular muscle mass is much larger than the atrial muscle mass, this signal is significantly larger. Ventricular contraction begins around the peak of the R wave. (Atrial repolarization also happens during this time, but it is obscured by the much larger QRS signal).
- T wave: Represents the repolarization of the ventricles, as they electrically reset and prepare for the next cycle.
The video you started earlier explains this relationship very well.
Cardiac Conduction System and Understanding ECG, Animation.
Let's return to the Alila Medical Media video to see how the conduction sequence creates the familiar ECG waveform.
Please watch the second part of the video, from 01:24 to 03:20. Pay close attention to how each wave (P, QRS, T) is explicitly linked to atrial or ventricular depolarization/repolarization.
The Cardiac Cycle: Where Electrical Meets Mechanical
The ultimate purpose of this electrical activity is to drive the mechanical pumping of the heart. The sequence of contraction and relaxation is known as the cardiac cycle.
The cycle has two main phases, named for the action of the ventricles:
- Systole: The phase of ventricular contraction and blood ejection.
- Diastole: The phase of ventricular relaxation and blood filling.
The electrical events (ECG) are the direct triggers for these mechanical events (the cardiac cycle).
- The P wave (atrial depolarization) triggers atrial systole, which pushes the final volume of blood into the already filling ventricles.
- The QRS complex (ventricular depolarization) triggers ventricular systole. This is a two-part process:
- Isovolumetric Contraction: The ventricles start contracting, causing the atrioventricular (AV) valves to snap shut. For a brief moment, all valves are closed, and pressure builds rapidly.
- Ventricular Ejection: The pressure in the ventricles exceeds the pressure in the aorta and pulmonary artery, forcing the semilunar valves to open and blood to be ejected from the heart.
- The T wave (ventricular repolarization) signals the beginning of diastole.
- Isovolumetric Relaxation: The ventricles relax, pressure falls, and the semilunar valves snap shut to prevent backflow. Again, all valves are briefly closed.
- Ventricular Filling: The pressure in the ventricles drops below the pressure in the atria, causing the AV valves to open, and the ventricles begin to fill passively with blood, preparing for the next cycle.
This interplay between electrical signals, pressure changes, and blood volume is complex. A video explanation can be very helpful.
The 'Cardiac Cycle' video from Dr. Matt & Dr. Mike provides a fantastic, detailed walk-through of how the ECG relates to the mechanical phases of systole and diastole.
Please watch from 07:36 to 18:00. This is the core of the video, where the presenters map the ECG waves directly onto the mechanical events: ventricular filling, atrial contraction, isovolumetric contraction, ejection, and isovolumetric relaxation. They also explain when the famous 'lub' (S1) and 'dub' (S2) heart sounds occur in relation to these events.
Test your understanding!
A patient's ECG shows a normal P wave and QRS complex, but the T wave is inverted (points downwards). Based on what you've learned:
- Which electrical process does the T wave represent?
- What phase of the mechanical cardiac cycle might be affected by an abnormality in this process?
Show answer
- The T wave represents ventricular repolarization, which is the electrical resetting of the ventricular muscle cells after contraction.
- Since ventricular repolarization immediately precedes ventricular relaxation, an abnormality here could affect diastole, specifically the isovolumetric relaxation phase and the subsequent filling of the ventricles.
Finally, for a static reference that puts all these concepts together, Figure 2 in the following paper is one of the most classic diagrams in cardiovascular physiology. It shows how the ECG, pressure curves, and volume changes all align in time.
Cardiac physiology for biomedical engineering
The paper 'Cardiac physiology for biomedical engineering' contains a highly informative figure that visualizes the entire cardiac cycle.
Please find Figure 2 within the document. You don't need to read the entire text, but focus on this figure. Observe the temporal relationship between: The Electrocardiogram (curve e) The Left ventricular pressure (curve c) The Ventricular volume (curve d) Notice how the QRS complex aligns with the sharp rise in ventricular pressure and the drop in ventricular volume (ejection). See how the T wave aligns with the fall in ventricular pressure.
Conclusion
In this lesson, we have dissected the electrical and mechanical sequence of a single heartbeat. You now have a foundational understanding of how the heart's intrinsic electrical system drives its function as a pump.
Key Takeaways:
- The heart's electrical conduction system, starting with the SA node, generates and distributes impulses to create coordinated contractions.
- The AV node provides a critical delay, allowing the atria to contract before the ventricles.
- The ECG is a surface recording of this activity, where the P wave reflects atrial depolarization, the QRS complex reflects ventricular depolarization, and the T wave reflects ventricular repolarization.
- These electrical events directly cause the mechanical cardiac cycle: the QRS complex triggers systole (contraction/ejection), and the T wave initiates diastole (relaxation/filling).
Preview of the Next Lesson:
Now that we understand the origin and meaning of the heart's electrical signal, we can ask: How do we best measure it from the outside? In the next lesson, we will delve into the practicalities of ECG recording, starting with Einthoven's triangle and the configuration of the 12-lead ECG system. This will explain why we place electrodes in specific locations to get a complete picture of the heart's electrical health.
Can't find a good explanation? Sign up and we'll make it for you
Sign up