
Hello! Welcome back to your course on Medical Instrumentation.
In our previous lesson, we established the "what" and "where" of ECG measurement by exploring Einthoven's triangle and the full 12-lead system. You learned how different electrode placements create specific "views" or leads, allowing for a comprehensive 3D picture of the heart's electrical activity.
This lesson addresses the next logical step: learning to interpret the signal itself. The learning outcome is to identify P, QRS, and T waves on an ECG trace and measure key intervals (PR, QRS duration, QT). We will break down the typical ECG waveform of a single heartbeat, correlating each bump and wiggle to the specific physiological events of the cardiac cycle you've learned about.
For your work at Neuraease, this is a foundational skill. While ECG might not be your primary signal, understanding its components is essential for accurately analyzing Heart Rate Variability (HRV). Every HRV calculation begins with the precise detection of the R-wave within the QRS complex, which serves as the main timing marker for the heartbeat. Mastering this will give you a deeper understanding of the data you're already working with.
The Anatomy of a Heartbeat
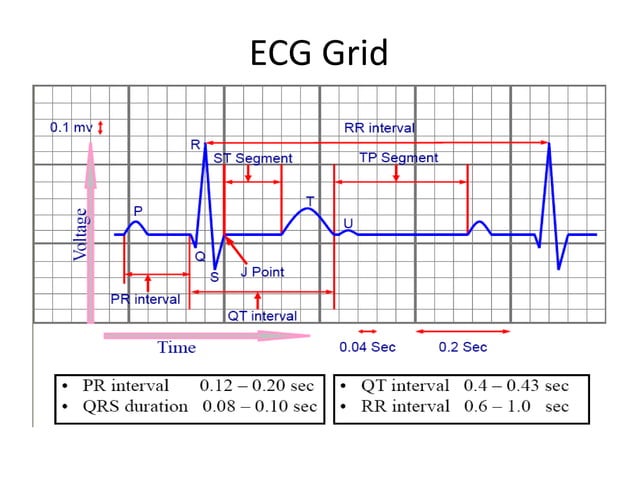
When you look at a single cardiac cycle on an ECG trace, you see a characteristic pattern of waves. These are not random; each wave corresponds to a specific electrical event—either the depolarization (activation) or repolarization (recovery) of a particular part of the heart muscle.
The main components are:
- P wave: The first small upward wave. It represents the depolarization of the atria.
- QRS complex: The large, spiky complex. It represents the rapid depolarization of the ventricles. It consists of three parts:
- Q wave: The first downward deflection.
- R wave: The large upward deflection.
- S wave: The downward deflection after the R wave.
- T wave: The broader, rounded wave that follows the QRS complex. It represents the repolarization of the ventricles.
You might be wondering where atrial repolarization is. It actually occurs at the same time as ventricular depolarization, but its electrical signal is so small compared to the massive QRS complex that it is completely masked.
From Electrical Conduction to ECG Waves
To truly understand how these waves are formed, it helps to visualize the sequence of electrical events. The following video does an excellent job of animating how the spread of depolarization and repolarization through the heart's conduction system creates the P, QRS, and T waves as seen on Lead II.
From Basics of 12 Lead ECG to How Waves are Produced: Everything about Normal Electrocardiogram
The video 'From Basics of 12 Lead ECG...' by the Nonstop Neuron channel provides a clear, animated explanation of how the cardiac cycle's electrical events translate into the ECG waveform.
Please watch from 17:49 to 25:28. This section meticulously follows the impulse from the SA node through the atria (P wave), the septum and ventricles (QRS complex), and finally, ventricular repolarization (T wave).
Measuring the Cardiac Cycle: Segments and Intervals
Clinicians and engineers don't just look at the shape of the waves; they precisely measure the time between them. These measurements provide critical diagnostic information about the heart's function. It's important to distinguish between two types of measurements:
- Segment: A flat, isoelectric line between waves.
- Interval: A duration that includes at least one wave.
This next short video clearly explains the most important segments and intervals.
Parts of an ECG | EKG Basics | Waves Segments Intervals | Cardiac Physiology
The video 'Parts of an ECG' from Byte Size Med offers a concise breakdown of the key segments and intervals and their significance.
Watch from 03:28 to 06:53. Pay close attention to the definitions of the PR interval, QT interval, and the ST segment. Note the distinction that an interval includes a wave, while a segment is the flat line between waves.
To summarize the key time measurements:
- PR Interval: Measured from the beginning of the P wave to the beginning of the QRS complex. It represents the time taken for the impulse to travel from the SA node, through the atria, and to the ventricles (including the crucial AV node delay). A normal PR interval is 0.12 to 0.20 seconds.
- QRS Duration: Measured from the beginning of the Q wave to the end of the S wave. It represents the time for ventricular depolarization. Since this process uses the high-speed Purkinje network, it should be fast. A normal QRS duration is 0.06 to 0.10 seconds.
- QT Interval: Measured from the beginning of the QRS complex to the end of the T wave. It represents the total duration of ventricular electrical activity (both depolarization and repolarization). Its duration varies with heart rate, but a corrected value (QTc) is typically less than 0.44 seconds.
For a solid textual reference on these components and their normal values, please review the following resource.
CV Physiology | Electrocardiogram (EKG, ECG)
The 'Electrocardiogram (EKG, ECG)' article on CVPhysiology.com provides an excellent, concise summary of each waveform component and interval.
Please read the sections titled 'P wave (atrial depolarization)', 'QRS complex (ventricular depolarization)', 'ST segment', 'T and U waves', and 'QT interval'. Focus on the definitions and the normal duration ranges provided for each interval.
How to Perform the Measurement
To measure these intervals, you need to understand the standard ECG grid.
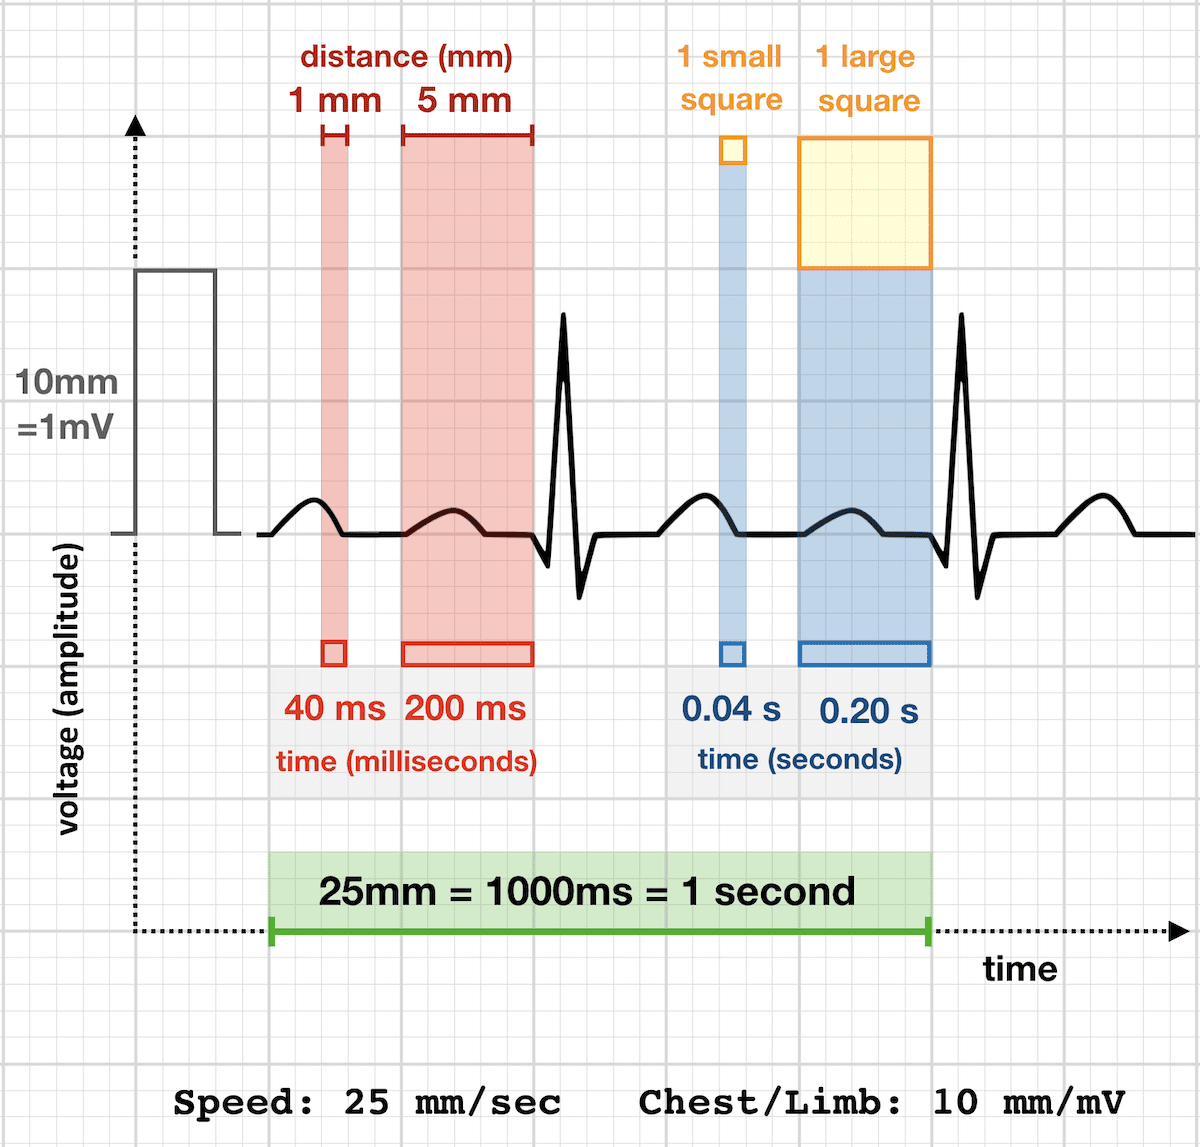
With this information, you can calculate any duration by simply counting the number of small squares and multiplying by 0.04 seconds.
The following clip demonstrates this process visually.
Parts of an ECG | EKG Basics | Waves Segments Intervals | Cardiac Physiology
Let's return to the 'Byte Size Med' video for a practical demonstration of how to use the ECG grid to measure durations.
Watch from 06:53 to 08:10. The video clearly explains how to translate the number of boxes on the grid into a time measurement in seconds.
Test your understanding!
On a standard ECG tracing (25 mm/s), you measure the following:
- The QRS complex spans 2 small squares.
- The period from the beginning of the P wave to the beginning of the QRS complex spans 4.5 small squares.
Calculate the QRS duration and the PR interval in seconds. Are these values within the normal range?
Show answer
-
QRS Duration:
- 2 small squares * 0.04 s/square = 0.08 seconds.
- This is within the normal range of 0.06 to 0.10 seconds.
-
PR Interval:
- 4.5 small squares * 0.04 s/square = 0.18 seconds.
- This is within the normal range of 0.12 to 0.20 seconds.
Conclusion
In this lesson, you've learned to dissect the ECG waveform, the fundamental signal of cardiac electrophysiology. You can now connect the visual components of the trace to the underlying electrical events in the heart and perform basic quantitative measurements.
Key Takeaways:
- The P wave represents atrial depolarization.
- The QRS complex represents ventricular depolarization. Its R-wave component is the key feature used in most heart rate and HRV detection algorithms.
- The T wave represents ventricular repolarization.
- Key diagnostic intervals include the PR interval (AV conduction time), QRS duration (ventricular activation speed), and QT interval (total ventricular electrical activity time).
- Measurements are made using the standard ECG grid, where 1 small square = 0.04 seconds.
Preview of the Next Lesson:
Now that you can confidently identify the parts of an ECG, especially the prominent R-wave, you are ready for the next step. Our next lesson will focus on the learning outcome: Calculate instantaneous and average heart rate from an ECG recording. We will use the R-R interval (the time between consecutive R-waves) to derive this vital physiological parameter.
Can't find a good explanation? Sign up and we'll make it for you
Sign up