
Hello! Welcome back to your course on advanced topics in performance marketing.
In our last lesson, we focused on interpreting customer journey analysis to find critical touchpoints and friction points using the data we can track. This gave us a powerful lens for optimizing known user paths.
Today, we address a crucial follow-up question: What about the parts of the journey we can't see? Your learning outcome is to explain the limitations of attribution in a multi-device, online-to-offline customer journey. Understanding these limitations is not just a technicality; it's a core strategic competency for any marketing leader. It protects you and your team from making poor budget decisions based on incomplete or misleading data.
1. The Modern Customer Journey: A Messy Reality
As you know from your extensive experience, the neat funnels we draw on whiteboards rarely reflect reality. Customers interact with brands across a wide array of digital and physical touchpoints, often simultaneously.
This image below provides a glimpse into that complexity. A single customer might see a social media ad on their phone, visit a store in person, receive an email on their work computer, and finally make a purchase on their personal laptop.
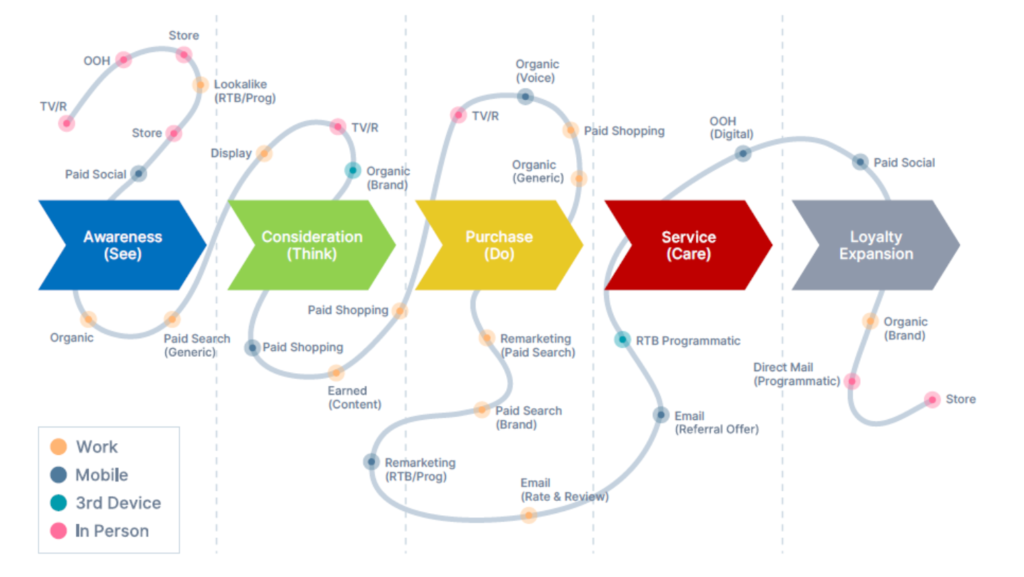
This fragmented journey creates significant blind spots for most standard attribution models, which were built for a simpler, single-device world. Let's break down the two biggest challenges this creates.
2. Challenge 1: The Multi-Device Journey
The most common blind spot is the multi-device journey. A user might discover your brand via a Meta ad on their phone during their commute, do more research on a tablet at home, and complete the purchase on their work laptop the next day.
From a standard analytics perspective, this often looks like three separate, un-related visits from three different "users." The initial discovery touchpoint on mobile gets no credit, and the final touchpoint on the laptop is incorrectly seen as a simple, one-step journey.
To get a clear overview of this problem, let's start with a short reading.
Cross-device attribution challenge you can't ignore
The article 'Cross-device attribution challenge you can’t ignore' from Croud provides an excellent summary of why this is a major source of measurement bias.
Please read the first section, 'What is the problem?'. Focus on how device switching penalizes upper-funnel marketing activities.
As the article highlights, this measurement bias systematically undervalues early, awareness-building touchpoints and overvalues the final, conversion-focused touchpoints.
How Technology Tries to Solve It (And Where It Fails)
To have productive conversations with analytics teams or vendors, you need to understand the two main technical methods used to connect these user journeys across devices.
Cross-device attribution challenge you can't ignore
The same article from Croud explains the technical solutions and their significant challenges. This is crucial knowledge for evaluating any vendor's claims about their attribution capabilities.
Now, please read the sections 'Technical solutions' and 'Challenges'. Pay close attention to the distinction between 'deterministic' and 'probabilistic' linking, and the three main challenges outlined.
Let's summarize the key concepts and, more importantly, the limitations you need to be aware of as a leader:
-
Deterministic Linking: This involves matching a user across devices using a persistent, unique identifier, like a customer login or email address. It's highly accurate when available.
- Limitation: It only works for users who are logged in, creating a heavy bias. You get a clear picture of your existing, loyal customers but remain blind to the journey of anonymous new prospects. Conclusions drawn from this group may not apply to new customer acquisition.
-
Probabilistic Linking: This uses algorithms to make an educated guess, connecting devices based on non-personal data points like IP address, browser type, time of day, and operating system.
- Limitation 1: Privacy & Regulation: Methods that rely on pooling data across different companies to build a "device graph" are under intense scrutiny due to regulations like GDPR. Relying on them is a significant compliance risk.
- Limitation 2: Accuracy & Data Freshness: These models are not perfect. The article explains the "precision vs. recall" problem: a model might correctly predict that 3% of mobile users will switch to a desktop, but it can't tell you which specific 3%. Furthermore, the data gets stale quickly as people change devices.
Your key takeaway as a leader is to be skeptical of any solution that promises a "perfect" view of cross-device behavior. Always ask vendors or your team:
- "Is this based on deterministic or probabilistic matching?"
- "What percentage of our total user base can you deterministically match?"
- "For probabilistic matching, how do you validate your model's accuracy, and what are the precision/recall rates?"
3. Challenge 2: The Online-to-Offline (O2O) Journey
The second major limitation arises when the customer journey crosses the digital-physical divide. For any business with a physical presence (retail stores, clinics, showrooms), this is a multi-million dollar measurement problem.

A customer might see your YouTube ad, click a search ad for directions, and then make a purchase in-store. Standard digital attribution will give 100% of the credit to the "search" campaign, completely missing the fact that the high-impact YouTube ad initiated the entire journey.
The following article provides excellent, real-world examples of these O2O challenges.
The Real Challenges of Marketing Attribution (And How to Fix ...
The article 'The Real Challenges of Marketing Attribution' by Reportdash dives into several core issues, including those related to untracked and offline touchpoints.
Please read the sections '1. Untracked Touchpoints' and '8. Offline Interactions Not Captured Digitally'. Focus on the examples provided and the proposed 'fixes', which often involve accepting incomplete data.
The core limitations in O2O attribution are:
- The Data Black Hole: Your digital analytics platforms (like Google Analytics or Meta Ads) have no native visibility into what happens inside your physical locations.
- Misattribution to Bottom-Funnel Actions: The credit defaults to the last trackable digital action (e.g., a map search), not the initial, often more influential, upper-funnel stimulus.
- Ignoring Non-Digital Influences: Word-of-mouth, seeing a billboard, or hearing a radio ad are powerful drivers that are completely invisible to digital attribution systems.
4. Strategic Implications: Overweighting the Trackable
When you combine the multi-device and online-to-offline challenges, a dangerous strategic bias emerges: we tend to value what is easy to measure over what is truly effective. This is often called the "streetlight effect"—searching for your lost keys under the streetlight, not because that's where you lost them, but because that's where the light is.
The Reportdash article has a short, powerful section on these "hidden" problems that directly speaks to the strategic challenges you will face.
The Real Challenges of Marketing Attribution (And How to Fix ...
This final reading moves from specific limitations to the broader strategic mistakes they can cause.
Please read the section titled 'Hidden Attribution Problems Nobody Talks About'. These points are essential for your transition into a strategic leadership role.
Let's emphasize the three most critical points for a marketing leader:
- Attribution ≠ Impact: A channel can get credit without having any real causal impact. For example, a branded search ad may get credit for a sale from a loyal customer who was going to buy anyway.
- Click-Based Models Miss Influence: Your experience in social media marketing is highly relevant here. A great social campaign can build immense brand affinity and purchase intent that leads to a sale weeks later, but because it didn't generate a direct click, it gets zero credit in many models.
- Overweighting the Trackable: This is the ultimate danger. If you allocate budget based purely on what your attribution tool says, you will systematically defund high-funnel, brand-building, and offline-driving activities in favor of bottom-funnel, demand-capturing activities. This can slowly starve your business of future growth.
Test your understanding!
You are the Head of Performance Marketing for a national retailer that sells electronics both online and in-store. Your team presents a report from your last-click attribution model showing that "Branded Search" (people searching for your brand name) delivers a 20:1 ROAS, while "YouTube Awareness Campaigns" have a ROAS of only 0.5:1. A junior manager suggests shifting 50% of the YouTube budget to Branded Search.
Based on what you've learned in this lesson, what are two key attribution limitations you would explain to your team before making a decision? What is one critical question you would ask your analytics team to investigate?
Show answer
-
Limitation 1 (Online-to-Offline): The YouTube campaigns may be driving significant in-store foot traffic and sales, which are not being captured by the digital-only attribution model. The 0.5:1 ROAS only reflects online sales and is likely understating the campaign's true value.
-
Limitation 2 (Overweighting the Trackable / Misinterpreting the Funnel): Branded Search is a demand-capturing channel, not a demand-creating one. The high ROAS is likely because it's the final, easily trackable step for customers whose purchase intent was created by other activities, including the YouTube campaigns. Shifting budget away from YouTube could lead to a long-term decline in branded search volume and overall sales.
-
Critical Question: "Can we run a geo-lift test or analyze the correlation between YouTube ad spend in specific regions and the corresponding lift in both in-store sales and branded search volume in those same regions?" This question seeks to find a causal link, moving beyond the flawed attribution data.
Conclusion
Understanding the limitations of attribution isn't about giving up on measurement. It's about developing the wisdom to look beyond the dashboard. Your role as a leader is to constantly challenge the data and foster a culture that balances easily-measured optimizations with strategic investments that may be harder to track.
Key Takeaways:
- Modern customer journeys are fragmented across multiple devices and online/offline channels, breaking traditional attribution models.
- Technical solutions for cross-device tracking are imperfect, with significant limitations related to privacy, accuracy, and bias.
- Online-to-offline attribution has a fundamental data gap, leading to misattribution of value to bottom-funnel digital touchpoints.
- The most significant strategic risk is overweighting the trackable, which can lead to poor budget allocation by defunding demand-creation channels.
Preview of the Next Lesson:
We've spent this lesson detailing the problems with attribution. So, how do we make better decisions? In the next lesson, we will introduce a powerful concept to help us do just that. We will analyze scenarios where attribution reports and incrementality tests provide conflicting signals, which will be our first step toward measuring true causal impact rather than just correlation.