
Hello. In the preceding lessons, you identified a protocol’s actors, assets, contracts, external dependencies, privileged roles, and economic flows. This final lesson in the module combines those pieces into one analytical artifact: a causal diagram.
A good protocol diagram does more than show that “users interact with contracts.” It explains how the service works, what conditions keep it working, what can break, and whose capital absorbs the resulting loss. We will use a simplified pooled lending market, modeled on Aave’s documentation, because it makes the allocation of risk especially visible: suppliers fund the pool, borrowers create credit risk, oracle prices and parameters determine safety, and liquidators intervene when collateral becomes insufficient.
By the end, you should be able to create a diagram that answers four questions:
- What service does the protocol provide?
- What assets and rules make that service possible?
- What events can cause losses or impaired service?
- Who bears the immediate loss, and who bears any residual loss?
From a transaction map to a causal diagram
A transaction map records actions: “the user deposits,” “the contract issues a receipt token,” “the borrower repays.” That is useful, but it does not yet explain the system.
A causal diagram connects actions, states, rules, and outcomes. Its relationships should read as complete claims:
- More borrowing relative to supplied assets raises utilization.
- Higher utilization changes interest rates according to the rate model.
- A decline in collateral value reduces a borrower’s health.
- A health-factor breach permits liquidation.
- Timely liquidation protects the pool from an underwater debt position.
- Failed or delayed liquidation can leave a loss in the lending pool.
The goal is not to draw every contract call. It is to show the few relationships that determine whether the service remains solvent and usable under normal and stressed conditions.
The supplied hub-and-spoke diagram gives a useful starting visual language: it separates the user-facing lending interface from liquidity and shows liquidators as independent participants rather than as passive background infrastructure.
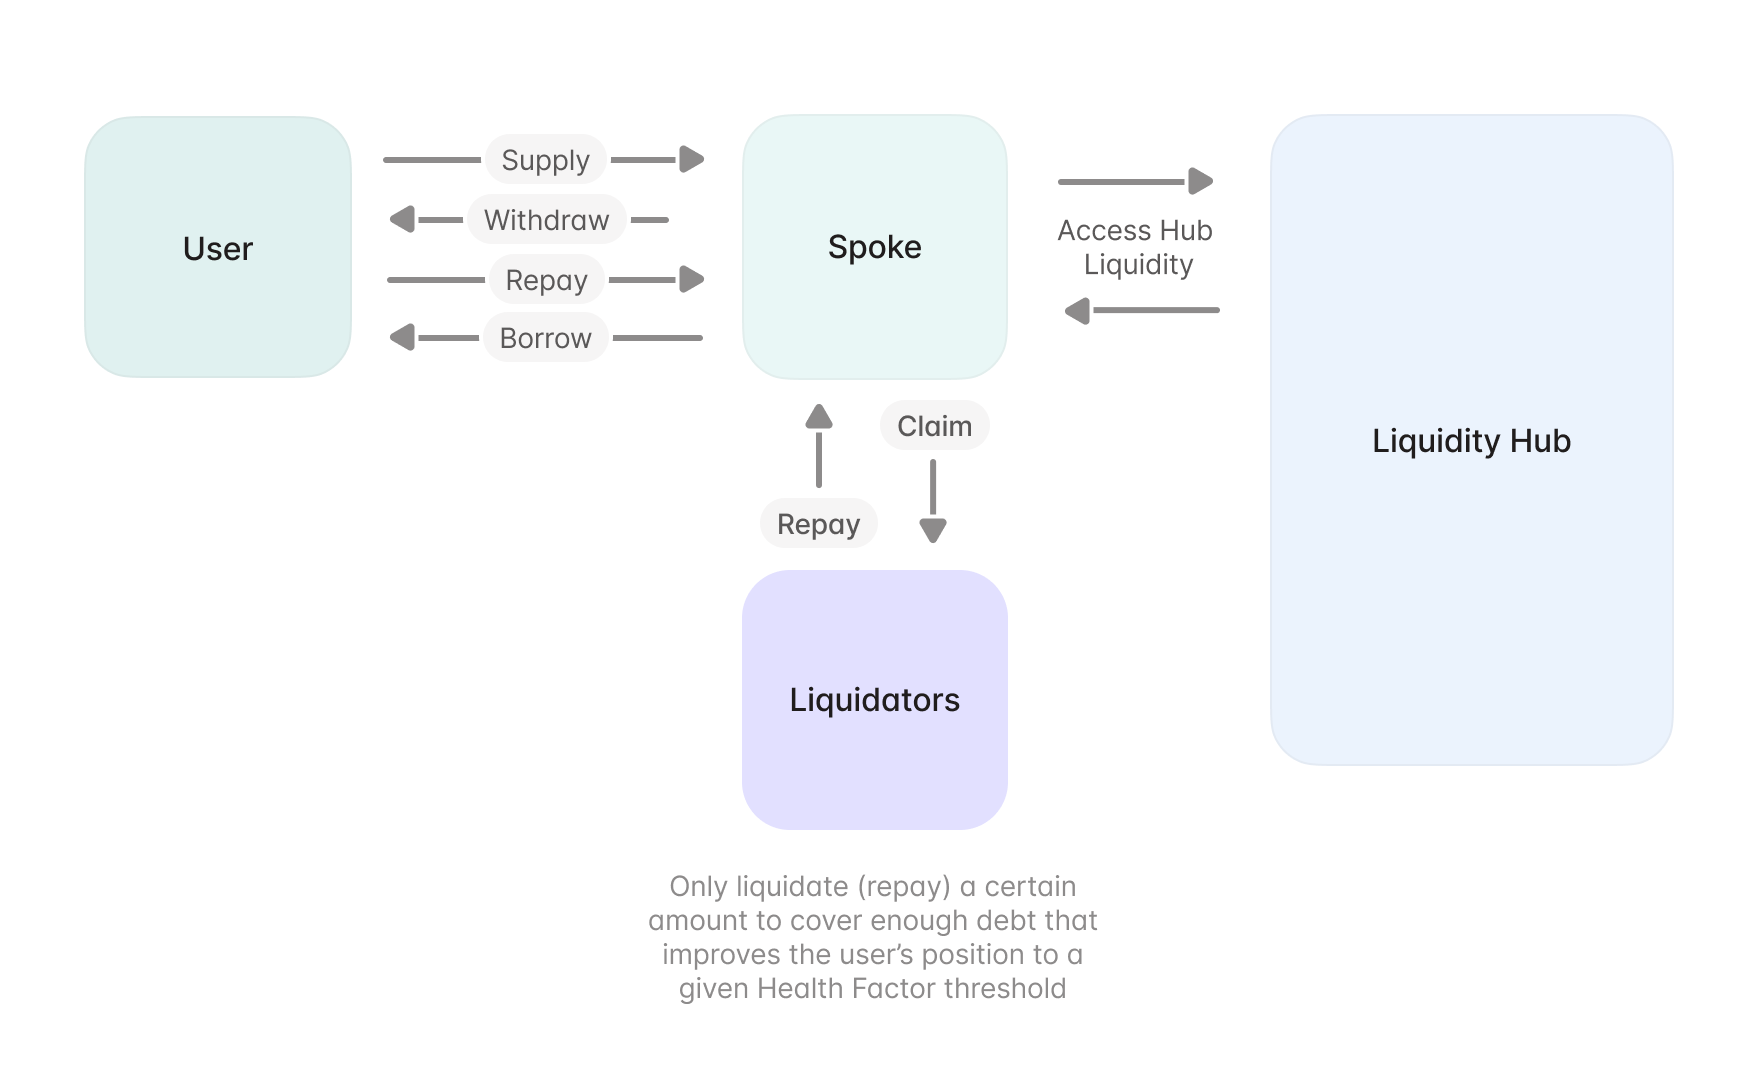
That diagram shows who interacts with whom. To evaluate risk, we must add answers to questions such as:
- What makes a borrower eligible to borrow?
- What determines whether collateral is enough?
- What makes a withdrawal available or unavailable?
- Who pays when collateral cannot cover debt?
- Who can alter those rules?
Establish the service before drawing risks
A pooled lending market offers two related services:
- Suppliers place assets into a shared pool and seek interest income.
- Borrowers lock eligible collateral and receive liquidity without selling that collateral.
The pool sits between the two sides. Suppliers do not generally select an individual borrower; instead, they accept pooled exposure to all outstanding debt in that market. Borrowers pay interest for access to the supplied assets. The protocol’s rules set collateral eligibility, borrowing capacity, interest-rate behavior, and liquidation conditions.
LiquidityPool | Aave Protocol Documentation
Read Aave Protocol Documentation’s “Liquidity Pool” overview to ground the diagram in a primary-source description of pooled lending. Focus on the inputs that determine borrowing, supplier returns, withdrawal availability, and liquidation risk.
Start with the opening explanation under “Liquidity Pool.” Read the pool model and identify the protocol’s two-sided service. Then read the full “Supply” subsection, especially the utilization discussion. Notice that supplier interest depends on both borrowing activity and governance-set parameters. Continue through the “Withdraw” subsection. Read the withdrawal constraints; distinguish a supplier’s claim on the pool from immediately available underlying liquidity. Finally, read the “Borrow” subsection, from the borrowing logic. Record the causal role of collateral value, utilization, interest, and reserve-specific parameters.
A concise service statement for the diagram might be:
A pooled lending market converts supplied assets into borrowable liquidity. Borrowers must maintain sufficient collateral, and liquidators are economically incentivized to reduce debts that become undercollateralized. Interest rates respond to utilization so that borrowing demand and withdrawal liquidity remain balanced.
This is much stronger than merely writing “Aave is a lending protocol,” because it names the mechanisms that protect suppliers’ capital.
The building blocks of a useful diagram
Before drawing lines, sort each component into one of five types.
| Component type | Lending-market example | Why it belongs in the diagram |
|---|---|---|
| Actor | Supplier, borrower, liquidator, governance participant | An actor takes action, bears risk, or has authority. |
| Asset or balance-sheet state | Pool liquidity, collateral, outstanding debt | Assets are what users ultimately seek to protect or use. |
| Rule or control | Collateral threshold, interest-rate curve, liquidation bonus | Rules transform market conditions into allowed actions. |
| External dependency | Price oracle, blockchain, decentralized exchange liquidity | The protocol depends on these but does not fully control them. |
| Outcome | Interest earned, liquidation, withdrawal delay, bad debt | Outcomes show whether the service delivers value or transfers loss. |
A diagram should keep assets and claims on assets separate. For example:
- A supplier deposits USDC into a pool.
- The pool’s liquid USDC can decline when borrowers draw loans.
- The supplier may hold a receipt token or accounting balance representing a claim on pool assets plus accrued interest.
- That claim is not identical to instantly withdrawable USDC when utilization is high.
Likewise, a borrower may own collateral economically, but the protocol restricts withdrawal while it secures a loan. This is why “non-custodial” should be interpreted carefully: the user controls the wallet and signs transactions, while the smart contracts enforce conditions on assets placed in the protocol.
The core causal diagram: a simplified pooled lending market
The diagram below is deliberately simplified. It is not a claim about every Aave contract or parameter. Instead, it is a reusable model for a pooled, overcollateralized lending protocol.
Read this as a set of causal statements rather than a mechanical sequence.
Normal operation
In normal conditions, suppliers provide capital, and borrowers use that capital against collateral. Borrower interest is the economic source of supplier interest, while utilization affects the rates needed to attract supply and manage scarce liquidity.
If borrowers repay, pool liquidity increases. If suppliers withdraw, available pool liquidity falls. When a large share of supplied assets is borrowed, suppliers may still have a claim on the pool, but immediate withdrawal can be constrained by the amount of unborrowed liquidity.
Solvency protection
The health calculation connects the borrower’s collateral and debt to protocol rules. A falling collateral price or growing debt reduces the borrower’s margin of safety. If that safety threshold is crossed, the protocol allows a liquidator to repay some debt and receive collateral at a discount or bonus.
The liquidation bonus is not free protocol income. It is compensation to the liquidator and is normally funded by the borrower’s collateral. The borrower therefore bears the immediate cost of being liquidated. The economic purpose is to prevent a larger loss from reaching suppliers.
Liquidators : The Silent Killers of DeFi
Watch “Liquidators: The Silent Killers of DeFi” from The Defiant for an intuitive explanation of why liquidation exists and how liquidators turn an unhealthy borrower position into a recoverable pool claim.
In the section beginning around 5:24, watch the liquidation mechanism. Focus on three elements to add to your diagram: collateral declining below a threshold, liquidators repaying debt in exchange for discounted collateral, and competition among automated liquidators to execute quickly.
Add a risk-bearing overlay
The causal diagram tells you how a problem spreads. A risk-bearing overlay identifies who pays first and who may pay if the initial protection fails.
This distinction matters. Saying “the protocol bears risk” is often too vague. A protocol is a set of contracts, rules, assets, and stakeholders. The actual bearer might be the borrower, suppliers, a dedicated reserve, a liquidator, token holders, or a user whose transaction fails.
| Risk event | Causal path | Immediate bearer | Residual or ultimate bearer |
|---|---|---|---|
| Collateral price decline | Collateral value falls; borrower health worsens; liquidation becomes possible | Borrower, through loss of collateral and liquidation bonus | Suppliers if collateral cannot cover debt after liquidation |
| Borrower does not repay an underwater position | Debt exceeds economically recoverable collateral value | Suppliers collectively have the credit exposure | Any documented reserve or backstop may absorb losses first; otherwise suppliers’ pool claim is impaired |
| Wrong or stale oracle price | Incorrect price changes health assessment | Borrower if wrongly liquidated; protocol users if borrowing limits are too loose | Suppliers if bad debt results; potentially a reserve if one exists |
| High utilization and withdrawal demand | Most supplied assets are borrowed; fewer underlying assets are immediately liquid | Supplier seeking prompt withdrawal | Suppliers bear liquidity inconvenience; borrowers may face sharply higher rates |
| Smart-contract exploit | Contract rules or balances are compromised | Users with assets exposed to the affected contracts | Often suppliers and borrowers, unless a verified recovery or insurance mechanism applies |
| Unsafe governance action | Risk parameters or contract behavior change | Borrowers if rules tighten or collateral is disabled; suppliers if rules weaken | The stakeholder group exposed to the changed market, potentially including token holders if treasury funds are used |
| Blockchain congestion or high transaction cost | Liquidators cannot act quickly enough during a price shock | Liquidators bear failed-transaction and execution costs | Borrowers may be liquidated less favorably; suppliers may face residual bad debt |
| Liquidator execution failure | Liquidator cannot sell seized collateral near its expected value | Liquidator, if it has committed capital or pays for failed execution | Suppliers if no one liquidates before the position becomes deeply underwater |
Two principles make this table more precise.
Immediate loss is not always the final loss
Take a collateral crash. The borrower’s collateral is sold first, so the borrower is the immediate bearer. But if the market falls too rapidly, the oracle lags, blockspace is scarce, or collateral cannot be sold near its oracle value, the liquidation may recover less than the debt. The unresolved amount is bad debt. In a pooled market, that residual loss threatens the assets backing suppliers’ claims.
So the full claim is:
Liquidation shifts the first loss toward the borrower’s collateral, but liquidation quality determines whether the loss stops there or reaches the lending pool.
A mitigation is also a dependency
It is tempting to draw liquidation as if it eliminates risk. It does not. It replaces pure borrower credit risk with a bundle of dependencies:
- accurate and timely oracle prices;
- sufficiently conservative collateral parameters;
- liquid markets for collateral;
- liquidators with capital, software, and incentives;
- reliable blockchain inclusion during stress;
- contracts that execute correctly.
This is why a causal diagram should show both the protective mechanism and the conditions required for that mechanism to work.
Apply the four risk categories to the diagram
Earlier lessons distinguished custody, settlement, counterparty, and smart-contract risk. In a causal diagram, attach each category to the relevant mechanism rather than listing it separately at the bottom.
Custody risk
Users control their wallet keys and authorize interactions themselves, rather than transferring funds to a conventional financial intermediary. But assets supplied or pledged as collateral remain subject to the smart contract’s programmed rules.
- A user bears personal custody risk if their private key or signing process is compromised.
- Suppliers and borrowers bear protocol-level asset risk while their assets are held or accounted for by the contracts.
- A front-end compromise can lead a user to sign a harmful transaction even when the core contracts are sound.
Settlement and execution risk
On-chain transactions are not equivalent to immediate, guaranteed outcomes at the instant a user clicks a button.
- A borrower or supplier may pay gas for a transaction that fails or settles later than intended.
- During market stress, liquidators may face expensive, delayed, or reordered transactions.
- A delayed liquidation can transform an initially recoverable position into bad debt.
The direct cost may first fall on the transacting user or liquidator. The broader solvency consequence may fall on suppliers if the delay prevents sufficient debt recovery.
Counterparty risk
Pooled DeFi lending reduces reliance on a known individual borrower’s identity, but it does not erase economic counterparty exposure. Suppliers fund loans that borrowers may rationally abandon once debt exceeds the value of reclaimable collateral.
Overcollateralization and liquidation are the system’s answer to that problem. Thus, supplier counterparty risk is transformed into collateral-price, liquidity, oracle, and liquidation-execution risk.
Smart-contract risk
The lending service, rate calculations, collateral controls, and liquidation permissions are enforced by smart contracts. A fault in those contracts, an unsafe upgrade, or a compromised administrator can affect all users whose assets depend on that system.
A causal diagram should connect this risk to the pool, collateral, and governance or privileged authority nodes. It should not be represented as a generic “hack” bubble disconnected from the assets at stake.
A repeatable workflow for any DeFi protocol
Use the following workflow when creating your own causal diagram.
1. Define the system boundary
Write down exactly what you are diagramming.
For example:
One pooled USDC lending market on a specified chain, including suppliers, borrowers, collateral, liquidation, governance-set parameters, the price oracle, and blockchain execution.
A narrower boundary makes the diagram testable. Do not casually include a protocol’s token, every deployment, or an unrelated stablecoin unless it materially affects this market.
2. State the service in one sentence
Use the format:
The protocol enables [user group] to obtain [service] by using [assets and mechanism], subject to [key constraints].
For a pooled lending market:
The protocol enables borrowers to access pool liquidity against overcollateralized assets, while suppliers earn borrower-funded interest subject to utilization, collateral rules, and liquidation performance.
3. Draw the normal-state mechanism
Include:
- the paying or capital-supplying side;
- the service recipient;
- the pool or core contract;
- the assets locked, borrowed, or received;
- the rules that determine eligibility, pricing, and settlement;
- the source of any yield or fee.
Every connection should use a meaningful label such as “supplies assets,” “sets parameter,” “values,” “accrues interest,” or “permits liquidation.”
4. Add external dependencies and authorities
External dependencies often dominate risk even though they sit outside the core contracts. For lending, inspect at least:
- price sources;
- the underlying blockchain;
- exchanges or liquidity venues needed by liquidators;
- governance and privileged administrative controls;
- bridged or wrapped forms of collateral, where relevant.
Do not label an external dependency as trusted or trustless without explaining the specific thing it must do correctly.
5. Add stress events
For each key input, ask what happens if it fails or moves sharply:
| Input | Stress event to draw | Outcome to trace |
|---|---|---|
| Collateral price | Rapid fall | Health-factor breach, liquidation, possible bad debt |
| Oracle | Stale, wrong, or manipulated price | Incorrect borrowing capacity or incorrect liquidation |
| Liquidity | High utilization or supplier withdrawals | Withdrawal delay, higher rates, reduced borrowing capacity |
| Governance | Weak or compromised parameter change | Excess risk, impaired market function, or altered user rights |
| Blockchain | Congestion or disruption | Delayed user actions and liquidations |
| Smart contracts | Exploit or faulty upgrade | Loss or freezing of assets |
6. Attach risk bearers to outcomes
For each stress path, write one explicit allocation sentence:
If [event] occurs, [mechanism] causes the first loss or cost to fall on [party]. If [mitigation] fails, the remaining loss can reach [party].
Example:
If collateral prices fall sharply, the borrower’s health declines and liquidation becomes available. The borrower first loses collateral and pays the liquidation bonus; if collateral cannot be liquidated for enough value, suppliers can bear the remaining loss through impaired pool assets.
This language avoids a common analytical error: treating a risk-control mechanism as proof that no one can lose.
Quality checks before you rely on the diagram
A diagram is complete enough for initial diligence when you can answer “yes” to these questions:
- Does every claimed yield have an identifiable funding source?
- Does each borrowed asset have a funding source and a repayment path?
- Does every collateral rule depend on an identified price source?
- Does every major parameter have an identified authority that can set or change it?
- Does the diagram show what happens when liquidation works and when it does not?
- Does it distinguish a temporary liquidity constraint from a permanent asset loss?
- Does it identify the first-loss bearer and the residual-loss bearer?
- Are all risk reserves, insurance funds, or token-holder backstops included only when documentation verifies their existence and conditions?
If any answer is “no,” the right response is not to assume safety. Mark that part of the diagram as an unresolved dependency and seek primary evidence.
Key takeaways
A causal diagram turns protocol documentation into a testable explanation of the system.
- Begin with the service: who supplies capital, who uses it, and what rules make the exchange possible.
- Separate actors, assets, protocol rules, external dependencies, and outcomes.
- For a pooled lending protocol, the central causal relationship is that collateral value and debt determine borrower health; a health breach enables liquidation; successful liquidation protects the pool.
- Liquidation does not remove risk. It depends on prices, market liquidity, incentives, contract execution, and blockchain conditions.
- Risk allocation is layered: borrowers often bear first losses through collateral, while suppliers can bear residual credit losses if liquidations fail to recover enough value.
- Treat governance, oracles, liquidators, and the chain as material parts of the risk system, not background details.
In the next module, you will apply the same discipline to decentralized exchanges: mapping automated market makers, calculating pricing and slippage, and identifying who bears inventory, execution, and liquidity risks.
Can't find a good explanation? Sign up and we'll make it for you
Sign up