
Hello! Welcome to the final module of our course, System Design & Production Readiness.
In our last lesson, we focused on the internals of our services, learning how to select and justify data management strategies like CQRS and Event Sourcing. Now, we're zooming out to look at the system as a whole. As you build more and more microservices, a critical challenge emerges: how do you manage the complex web of interactions between them?
Today's lesson addresses this head-on. The learning outcome is to explain how a service mesh (e.g., Istio) enhances observability, security (mTLS), and traffic management. This is a key topic in senior-level system design interviews, as it demonstrates your ability to think about cross-cutting concerns at an architectural level, moving beyond the logic of a single service. We'll explore how a service mesh can solve problems that are tedious and error-prone to handle within each application's code.
1. The Problem: The Chaos of Inter-Service Communication
In a microservices architecture, what used to be simple in--memory function calls inside a monolith are now network requests. This introduces a host of new problems:
- Service Discovery: How does Service A find the network address of Service B?
- Load Balancing: If there are multiple instances of Service B, how is traffic distributed among them?
- Resilience: What happens if Service B is slow or fails? How do you implement retries, timeouts, or circuit breakers?
- Security: How do you ensure that only authorized services can talk to each other and that the data is encrypted in transit?
- Observability: If a request fails or is slow, how can you trace its path across ten different services to find the bottleneck?
Traditionally, in the Java ecosystem, these problems were often solved with libraries like Spring Cloud, which bundles tools like Eureka (discovery), Ribbon (client-side load balancing), and Hystrix/Resilience4j (circuit breakers). This "fat client" or "smart endpoint" approach requires each service to include these libraries and configurations.
This works, but it has drawbacks:
- Language-Specific: The library-based solution is tied to a specific language or framework (e.g., JVM). It's difficult to maintain consistency in a polyglot environment with services in Node.js, Go, or Python.
- Code Duplication & Drift: You have to manage library versions and configurations across dozens or even hundreds of services. An update to a resilience policy might require changing and redeploying every service.
- Developer Burden: Application developers are forced to deal with complex infrastructure concerns instead of focusing purely on business logic.
A service mesh offers a different approach.
2. What is a Service Mesh?
A service mesh is a dedicated, programmable infrastructure layer for managing, securing, and observing service-to-service communication. Instead of putting the "smarts" into each service with libraries, it moves them into the network itself.
Service Mesh Architecture with Istio
Let's start with a foundational article from Baeldung, a resource you're likely familiar with. It clearly defines what a service mesh is and the problems it aims to solve.
Please read the introduction (before section 3) and section 4, 'Introduction to Istio'. Focus on understanding: How a service mesh uses network proxies to manage communication. The fundamental architecture of Istio, which separates the system into a data plane and a control plane.
The core of a service mesh's data plane is the sidecar proxy. Istio, the most well-known service mesh, uses a powerful proxy called Envoy. When you deploy a service into the mesh, Istio automatically injects a sidecar proxy into your application's Pod. This proxy sits alongside your application and intercepts all incoming and outgoing network traffic. Your application code remains blissfully unaware; it thinks it's just sending requests to localhost or a simple service DNS name.
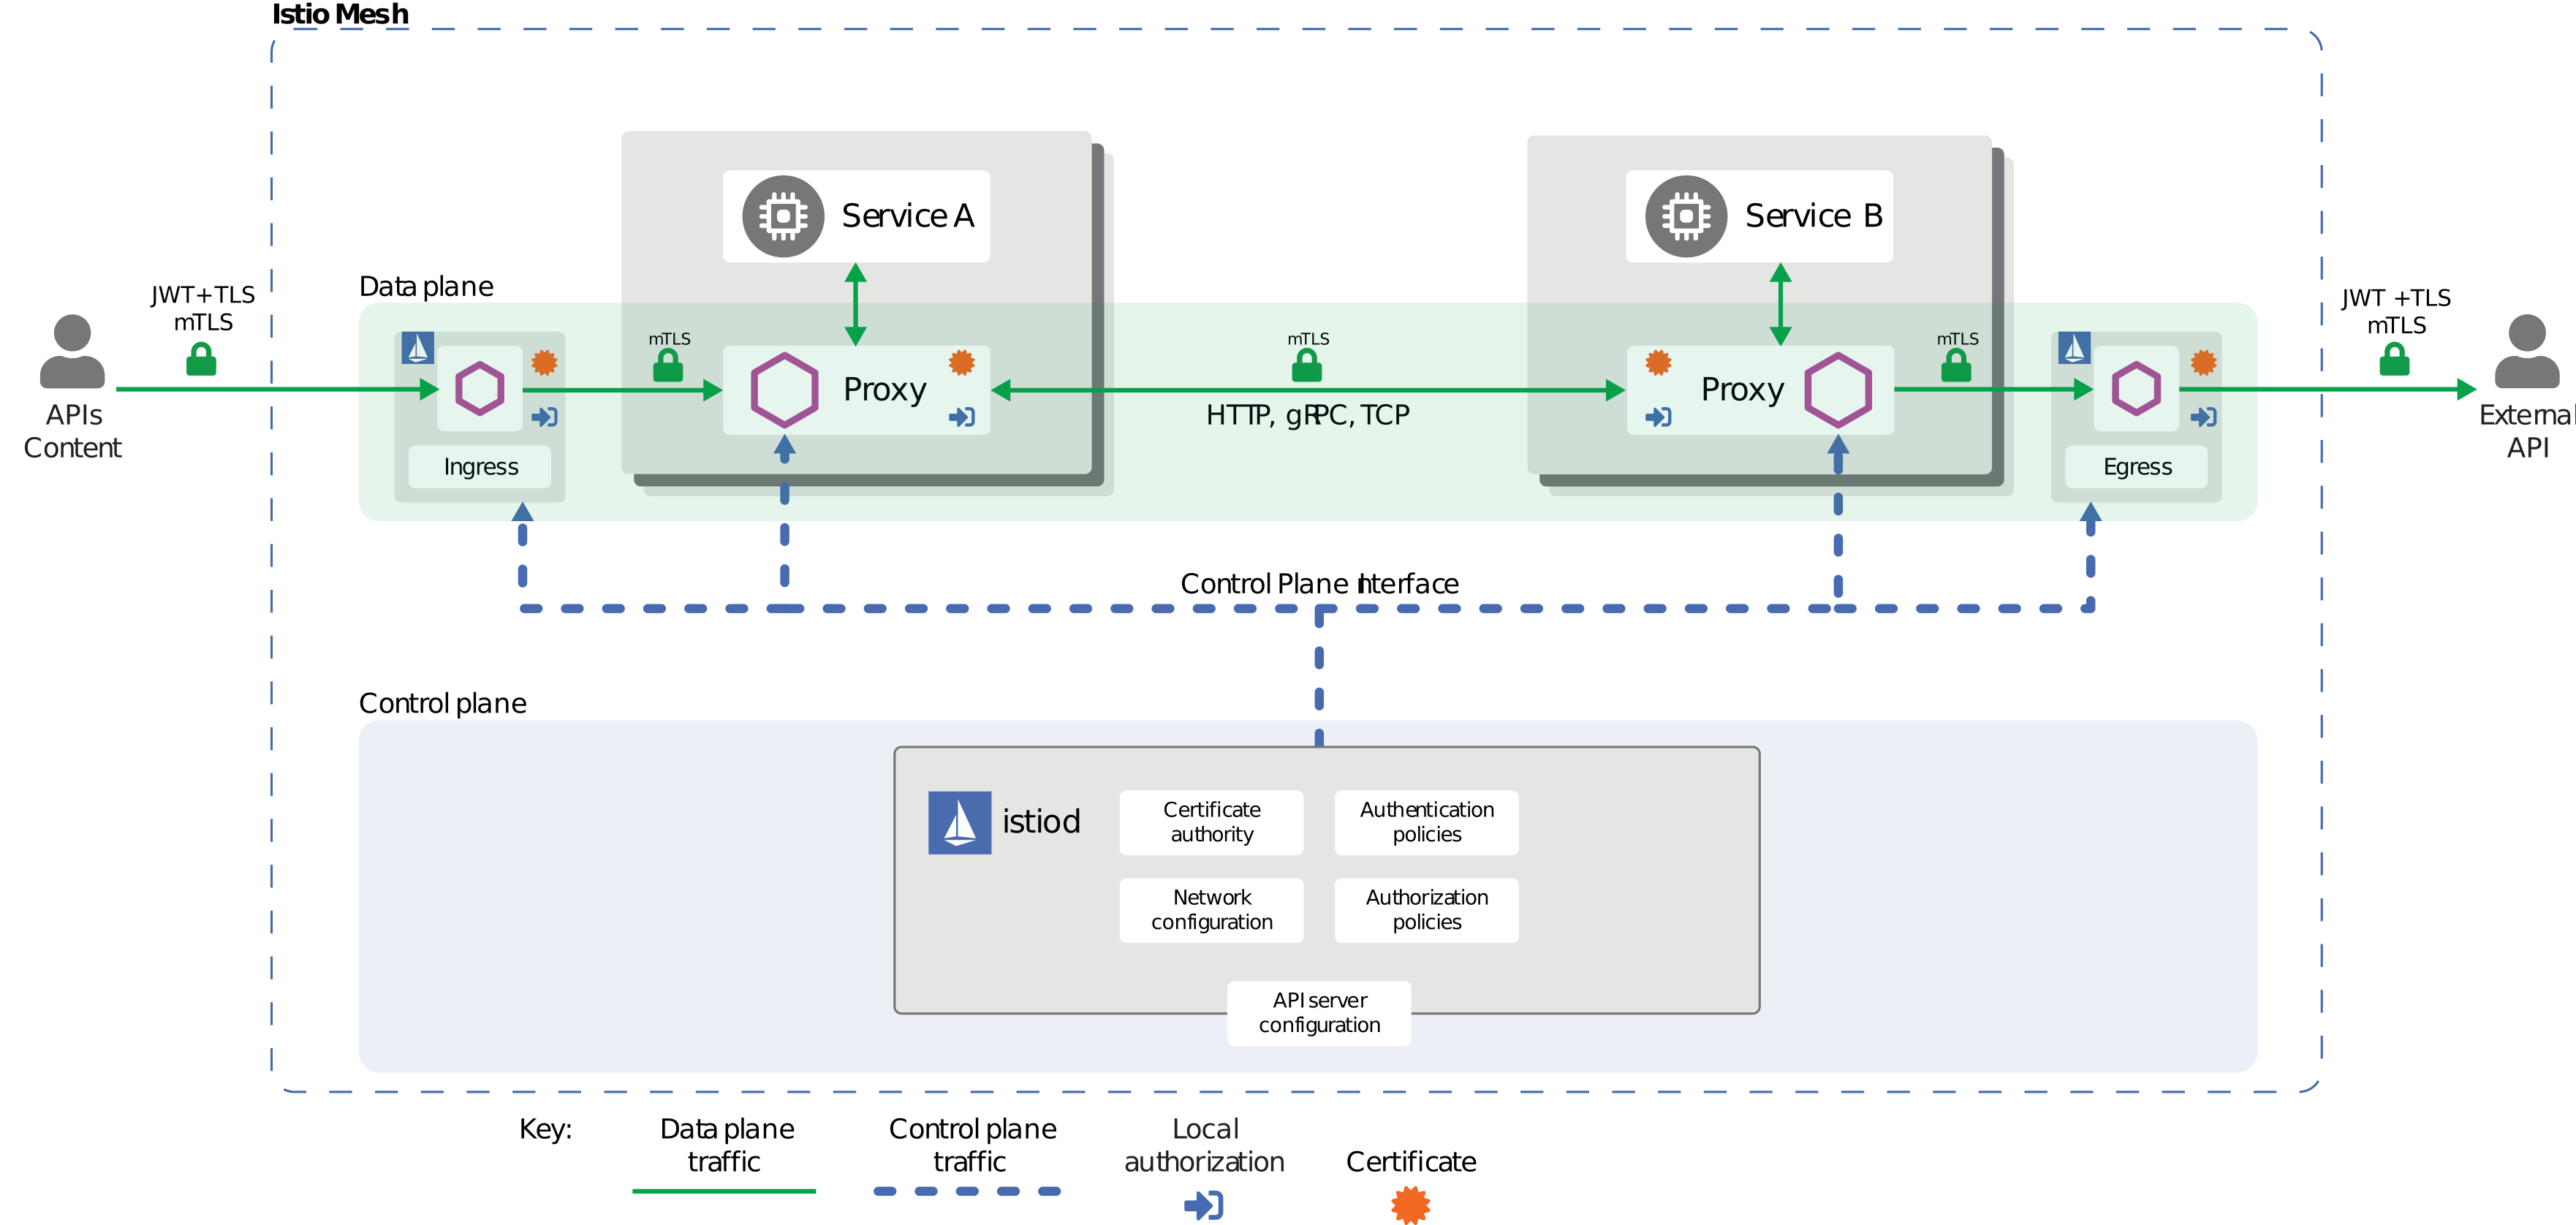
The network of all these proxies forms the data plane. The control plane (in Istio, a component called istiod) is the "brain" that configures and coordinates all the proxies in the data plane. You, as the operator, declare your intent (e.g., "send 10% of traffic to v2 of the reviews service") to the control plane, and it translates that into low-level rules for the Envoy proxies.
Now, let's explore how this architecture delivers on its promises across the three pillars of a service mesh.
3. Pillar 1: Enhancing Security with Automatic mTLS and Authorization
In a distributed system, especially in a zero-trust environment, you cannot assume the network is safe. A service mesh provides robust security guarantees out of the box, without requiring any changes to your application code.
Mutual TLS (mTLS)
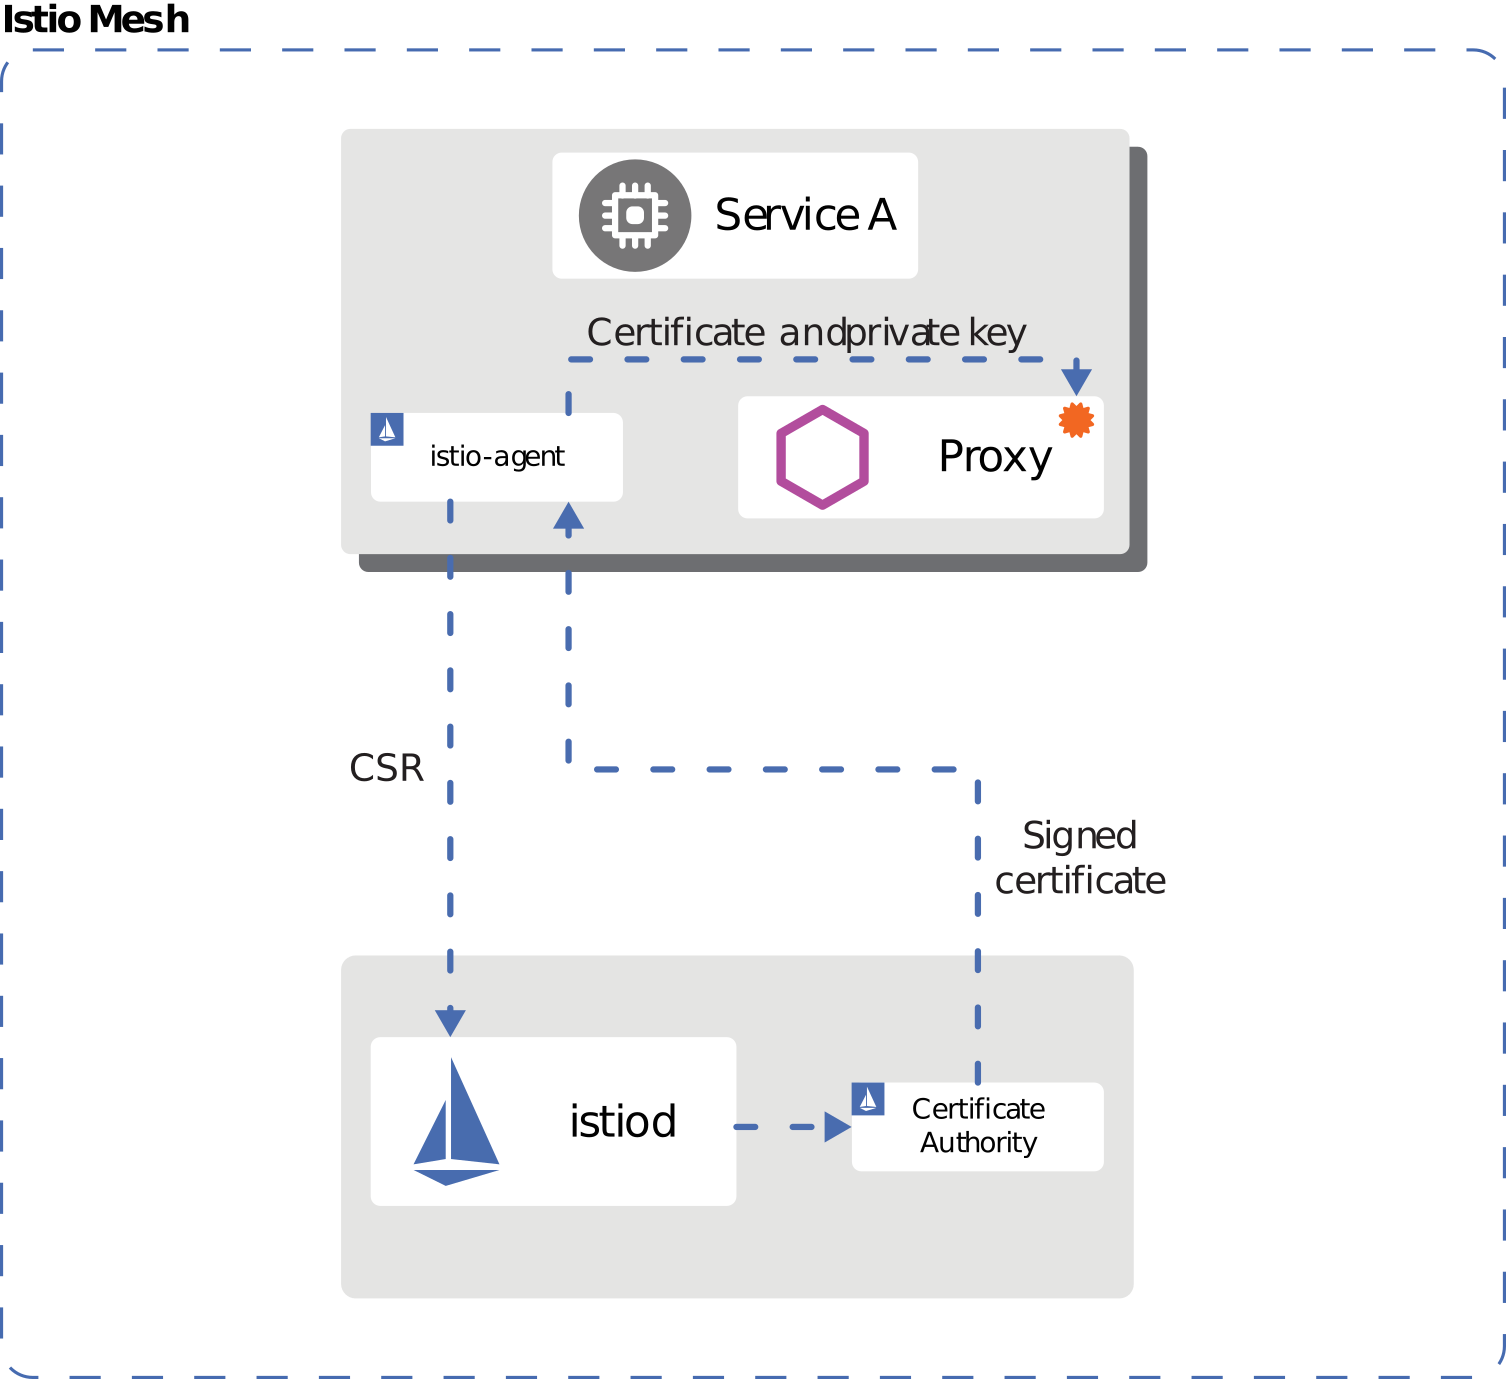
The cornerstone of service mesh security is mutual TLS (mTLS). Unlike standard TLS (like when you visit a website) where only the client verifies the server's identity, with mTLS, both the client and server present and validate certificates to prove their identities to each other. This ensures two things:
- Authentication: Service A can be certain it is talking to the real Service B, and not an imposter.
- Encryption: All traffic between them is encrypted, preventing eavesdropping or man-in-the-middle attacks.
Istio automates this entire process.
Authorization Policies
Once you have strong, cryptographically verifiable identities for every service, you can build fine-grained access control. Istio's AuthorizationPolicy allows you to define rules about who can talk to whom.
Exploring Istio: A Hands-On Guide to Enhancing ...
The article 'Exploring Istio' provides clear explanations and YAML examples for Istio's security features. This will help you understand how these concepts are put into practice.
Please read the section 'Security in Istio'. Focus on: The difference between PERMISSIVE and STRICT mTLS modes. How to use an AuthorizationPolicy to create both 'deny-all' and 'allow-list' rules.
In an interview, if asked how a service mesh improves on Kubernetes NetworkPolicy, you can explain that NetworkPolicy operates at L3/L4 (IP address/port). It's coarse-grained. Istio AuthorizationPolicy operates at L7, using the service's cryptographic identity (via mTLS) to allow or deny requests based on HTTP methods, paths, headers, or even claims inside a JWT.
4. Pillar 2: Enhancing Traffic Management and Resilience
This is where a service mesh truly shines, giving you sophisticated control over traffic flow without touching your application code. You simply declare your desired state to the control plane.
Key features include:
- Intelligent Routing & Traffic Splitting: Using
VirtualServiceresources, you can easily implement advanced deployment strategies. For a canary release, you can direct 99% of traffic to the stable version of a service and 1% to the new version. If you detect no issues, you can gradually shift more traffic. - Resilience Patterns: Instead of configuring Resilience4j in your Spring Boot
application.yml, you define resilience patterns in IstioDestinationRuleandVirtualServiceresources. This includes:- Retries: Automatically retry failed requests.
- Timeouts: Prevent a slow downstream service from holding up the caller indefinitely.
- Circuit Breakers (Outlier Detection): If a service instance consistently returns errors, the mesh will temporarily remove it from the load-balancing pool, allowing it to recover without causing cascading failures.
- Fault Injection: You can deliberately inject failures (e.g., delays or HTTP 503 errors) for specific services to test the resilience of your system in a controlled manner.
Reducing Microservices Architecture Complexity with Istio and Kubernetes
Watching these features in action is the best way to understand their power. This video provides an excellent demonstration of Istio's capabilities. We'll focus on the traffic management and observability parts.
Please watch the segment from 56:16 to 1:05:39. The speaker demonstrates several key traffic management features: Configuring an Ingress Gateway to expose a service. Fault Injection to force 503 errors. Traffic Splitting to perform a canary release between two versions of a service. Circuit Breaking via connection pooling and outlier detection.
5. Pillar 3: Enhancing Observability for Free
Because the sidecar proxy sees every single request entering and leaving a service, it can generate invaluable telemetry automatically. This is often called getting observability "for free" because your application doesn't need to be instrumented for it.
The mesh provides the three pillars of observability:
- Metrics: Each proxy automatically collects detailed metrics (the "golden signals": latency, traffic, errors, saturation) and exposes them in a format that Prometheus can scrape. You can then use tools like Grafana to build dashboards to monitor the health of your entire system.
- Distributed Traces: The proxies can automatically generate and forward tracing headers (e.g., B3 headers). This allows tools like Jaeger or Zipkin to stitch together the entire journey of a request as it hops between services, making it incredibly easy to pinpoint bottlenecks or find the source of an error.
- Access Logs: The proxies provide detailed logs for every request, giving you a full audit trail of service communication.
Reducing Microservices Architecture Complexity with Istio and Kubernetes
Now let's watch the observability demo from the same video. This is one of the most compelling arguments for a service mesh.
Please watch the segment from 34:38 to 56:16. Notice how, with a completely vanilla Java application (no Spring, no special libraries), the speaker gets: Metrics in a Grafana dashboard. A dynamic Service Graph showing real-time service dependencies. Distributed Traces in Jaeger, showing the full request flow.
Test your understanding!
You are a senior developer at a fintech company. A product manager reports that users are experiencing intermittent slowness when loading their account portfolio, an operation that involves calls to three different microservices (portfolio-service, positions-service, market-data-service). The system is deployed on Kubernetes and uses an Istio service mesh.
How would you leverage the service mesh to diagnose this issue?
Show answer
Here's a step-by-step approach using the service mesh:
-
Start with the Service Graph (Kiali): I would first look at the Kiali dashboard to visualize the real-time traffic flow between the services. I would check the graph for any links showing high latency (e.g., colored orange or red) or an elevated error rate between
portfolio-service,positions-service, andmarket-data-service. This gives me an immediate high-level view of where the problem might be. -
Drill Down with Distributed Tracing (Jaeger): I would then find a trace for a slow request. Since the user report is intermittent, I might need to look at several traces. In Jaeger, I can see the end-to-end latency and a breakdown of how much time was spent in each service and in network transit between them. This will tell me exactly which service call is the bottleneck. For example, I might see that the call from
positions-servicetomarket-data-serviceis taking 2 seconds, while all other calls are under 50ms. -
Analyze Metrics (Prometheus/Grafana): Now that I've identified
market-data-serviceas the likely culprit, I would go to the Grafana dashboard for that service. I'd look at its "golden signals" provided by Istio:- Latency: Is the p99 latency for this service spiking?
- Error Rate: Is the service returning an increased number of 5xx errors?
- Saturation: Are its CPU/memory resources hitting their limits? Is the request queue backing up?
This process allows me to systematically and efficiently narrow down the problem from the entire system to a specific service and a potential root cause, all using the observability data provided automatically by the service mesh, without needing to add a single line of logging or metrics code to the applications themselves.
Conclusion: The Trade-Offs
A service mesh is incredibly powerful, but it's not a silver bullet. Adopting one is a significant architectural decision with trade-offs you must be able to articulate in an interview.
Benefits (Recap):
- Uniformity: Provides consistent security, traffic management, and observability across all services, regardless of the language they're written in.
- Decoupling: Moves operational concerns out of the application code and into the infrastructure layer.
- Powerful Control: Enables sophisticated deployment strategies and resilience patterns with simple declarative configuration.
Costs & Trade-offs:
- Operational Complexity: You now have a new, critical piece of infrastructure to install, manage, upgrade, and monitor.
- Resource Overhead: The sidecar proxies consume CPU and memory in every pod, which can be a significant cost at scale.
- Added Latency: Every network call now involves two extra hops (service -> sidecar -> sidecar -> service). While Envoy is highly optimized, this adds a small amount of latency to every call.
The decision to use a service mesh depends on your scale and complexity. For a small system of a few services all written in Spring Boot, the library-based approach might be simpler. For a large, polyglot enterprise system with hundreds of services, the benefits of centralized control and uniformity often outweigh the costs.
Key Takeaways:
- A service mesh moves cross-cutting concerns like security, resilience, and observability from application libraries to a dedicated infrastructure layer.
- It works by injecting a sidecar proxy (like Envoy) next to each service to intercept all traffic.
- The control plane (
istiod) configures the fleet of proxies in the data plane. - Istio enhances security through automatic mTLS and fine-grained authorization policies.
- It enhances traffic management by enabling canary releases, retries, and circuit breakers via declarative configuration.
- It enhances observability by automatically generating metrics, traces, and logs for all service traffic.
In our next lesson, we will tackle a common point of confusion: "Compare the roles and trade-offs of using an API Gateway versus a service mesh." This will clarify how these two components fit together in a modern microservices architecture.
Can't find a good explanation? Sign up and we'll make it for you
Sign up