
Hello! Welcome back to our module on SEO and Organic Search Foundations.
In our last lesson, we focused on communicating with machines by adding SoftwareApplication schema markup to your page. This helps search engines understand the what of your content. Today, we shift our focus to the technical performance of your page—the how fast and how smooth—which is a critical factor for both user satisfaction and your Google rankings.
This lesson addresses the learning outcome: Analyze and identify improvements for Core Web Vitals using Google PageSpeed Insights. We will dive into Google's key user experience metrics, learn how to use their primary analysis tool, and discover how to turn that analysis into an actionable plan to make your SaaS landing pages faster and more responsive.
1. What are Core Web Vitals (CWV)?
Core Web Vitals are a set of specific metrics that Google considers crucial for a good user experience. They measure aspects of your site's loading speed, interactivity, and visual stability. A good CWV score can lead to better search engine rankings and, more importantly, a better experience for your users, which often translates to lower bounce rates and higher conversion rates.
There are three main pillars of Core Web Vitals:
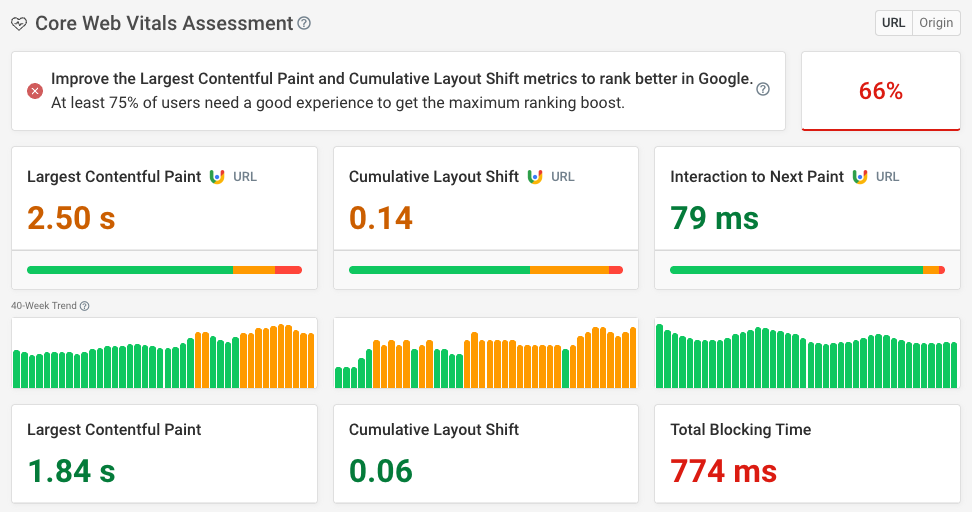
- Largest Contentful Paint (LCP): Measures loading performance. How long does it take for the main content of a page to become visible?
- Interaction to Next Paint (INP): Measures interactivity. How quickly does your page respond to user interactions like clicks, taps, and key presses? (Note: INP officially replaced an older metric, First Input Delay (FID), in March 2024).
- Cumulative Layout Shift (CLS): Measures visual stability. Do elements on the page move around unexpectedly as the page loads?
The following video from Ahrefs provides a concise overview of these metrics and why they matter beyond just SEO.
Core Web Vitals: How to Optimize Them for SEO
This video, 'Core Web Vitals: How to Optimize Them for SEO', provides a quick but clear introduction to the three Core Web Vitals and explains their direct impact on business metrics like user abandonment rates.
Watch the first 1 minute and 33 seconds of the video. Focus on understanding what LCP, CLS, and FID (now INP) represent and the business case for optimizing them.
When you analyze a page, these metrics are compiled into an overall assessment, which can either be "Passed" or "Needs Improvement".

2. Getting Started with Google PageSpeed Insights (PSI)
Your primary tool for this task is Google PageSpeed Insights (PSI). It's a free tool that analyzes the performance of a page and provides suggestions for improvement.
To start, simply go to pagespeed.web.dev, enter the URL of your SaaS landing page, and click "Analyze".
The first thing you must understand is that the report is split into two distinct types of data. This is a common point of confusion, so getting it right is key.
Field Data vs. Lab Data
Google PageSpeed Insights: Step-by-Step tutorial to Boost Site Speed
This video, 'Google PageSpeed Insights: Step-by-Step tutorial', from Rank Math SEO, offers an exceptionally clear explanation of the difference between the two data sources in your report.
Watch the segment from 02:11 to 04:34. Pay close attention to how it defines 'Field Data' (from real Chrome users) and 'Lab Data' (from a simulated test).
To summarize the key distinction:
- Field Data (Discover what your real users are experiencing): This data is collected from actual Chrome users who have visited your site over the last 28 days. It is also known as the Chrome User Experience Report (CrUX). This is the ground truth and is what Google uses as a ranking signal. If this section shows "Passed," you are in a good position.
- Lab Data (Diagnose performance issues): This data is collected "in the lab" at the moment you run the test. Google uses a simulated device on a throttled network connection to generate this report using a tool called Lighthouse. This data is for diagnostics. It helps you identify, reproduce, and fix performance issues.
Your workflow should be: Use Field Data to see if you have a problem. Use Lab Data to figure out how to fix it.
3. Deconstructing the PageSpeed Insights Report
Now, let's break down the key metrics you'll find in the report. The PSI tool provides a wealth of information, but we'll focus on the most critical parts for identifying improvements.
Key Metrics Explained
The Rank Math video provides simple, effective explanations for each of the core metrics.
Google PageSpeed Insights: Step-by-Step tutorial to Boost Site Speed
Let's continue with the same Rank Math video to understand each metric individually. The analogies used here are very helpful.
Watch the following segments to understand the key performance metrics: Largest Contentful Paint (LCP) (04:34 - 06:26): Understand what it measures and the most common cause (large images). Interaction to Next Paint (INP) (06:26 - 07:17): See how it measures the page's responsiveness. Cumulative Layout Shift (CLS) (07:17 - 08:52): Grasp why content shifting is a bad user experience and how to fix it. Total Blocking Time (TBT) (16:35 - 19:07): This is a critical lab metric. It measures how long the main thread was blocked by long tasks (often heavy JavaScript), preventing interactivity. Improving TBT is a primary way to improve INP. Given your CS background, the concept of a blocked 'main thread' should be familiar.
Opportunities and Diagnostics: Your Action Plan
This is the most valuable part of the Lighthouse (Lab Data) report. It gives you a prioritized list of specific actions you can take to improve your page's performance. Each suggestion includes an estimated time saving if you implement the fix.
Common recommendations you'll encounter for a SaaS landing page include:
- Eliminate render-blocking resources: This often refers to CSS and JavaScript files that must be loaded before the page can be displayed. The solution is often to inline critical CSS and defer the loading of non-critical JavaScript.
- Properly size images: Serving images that are larger than needed for the user's screen wastes data and slows down LCP.
- Serve images in next-gen formats: Formats like WebP or AVIF offer better compression than JPEG or PNG, resulting in smaller file sizes.
- Reduce initial server response time (TTFB): This points to issues with your hosting or backend. Using a Content Delivery Network (CDN) is a common fix.
- Minimize main-thread work: This is directly related to TBT and INP. It suggests your page is running too much complex JavaScript, which can be optimized by splitting code or breaking up long tasks.
Google's PageSpeed Insights Report: A Detailed Guide
For a clear, text-based overview of these common fixes, the DebugBear article 'Google's PageSpeed Insights Report: A Detailed Guide' is an excellent resource.
Read the section titled 'How to increase your page speed score with diagnostic data'. Skim through the 7 common recommendations to see what kind of actionable advice the report provides. You don't need to master each one, just recognize them.
Test your understanding!
You run a PageSpeed Insights report for your new SaaS landing page. The Lab Data shows a high Total Blocking Time (TBT) of 600ms, and the top opportunity listed is "Reduce unused JavaScript".
Which Core Web Vital is this most likely impacting for your real users, and what does this suggest about your page's code?
Show answer
A high TBT most directly impacts Interaction to Next Paint (INP). TBT is the lab metric that measures main-thread blocking, which is the primary cause of poor interactivity. The "Reduce unused JavaScript" opportunity suggests that your page is loading and parsing a lot of JavaScript code that isn't needed for the initial page view, which ties up the browser's main thread and makes the page unresponsive to user input.
Your Improvement Workflow
Based on what you've learned, here is a tactical workflow you can use for each of your SaaS projects:
- Analyze: Run your primary landing page URL through Google PageSpeed Insights. Always analyze the mobile report first, as Google uses mobile-first indexing.
- Assess: Check your Field Data. Does it say "Core Web Vitals assessment: Passed"?
- If yes, your site is performing well for most users. You can still look at the Lab Data for minor improvements.
- If no, you have a performance problem that is impacting real users and likely your SEO.
- Diagnose: Go to the Lab Data report. Look at the "Opportunities" and "Diagnostics" sections. Identify the top 1-3 recommendations with the largest estimated time savings.
- Implement: Implement the suggested fixes. As a developer, tasks like compressing images, setting
widthandheightattributes, or deferring scripts using<script defer ...>will be within your capabilities. - Verify: After deploying your changes, re-run the PageSpeed Insights test. You should see an immediate improvement in your Lab Data score. The Field Data will take up to 28 days to fully reflect the changes for your real users.
Conclusion
You've now learned how to measure, analyze, and diagnose your site's technical performance—a skill that is fundamental to building successful online businesses. A fast, responsive site is no longer a luxury; it's an expectation. By mastering PageSpeed Insights, you can ensure your SaaS products provide a great user experience from the very first click, giving you a competitive edge in both user satisfaction and search visibility.
Key Takeaways:
- Core Web Vitals (LCP, INP, CLS) are Google's metrics for measuring user experience.
- PageSpeed Insights provides two views: Field Data (real-user truth) and Lab Data (diagnostic tool).
- The "Opportunities" section in the lab report gives you a prioritized, actionable list of fixes.
- Improving technical performance directly impacts user engagement and SEO rankings.
Preview of the Next Lesson:
We have covered how search engines understand your page's content (schema) and performance (CWV). Next, we'll focus on the content itself. In our next lesson, you will learn to Use Surfer SEO or Clearscope to optimize a blog post for a target keyword and search intent. This will teach you how to create content that is not only well-written but also semantically optimized to rank at the top of Google.