
Good to see you again. In the previous lesson, you built a workload model for a flash-sale checkout journey: 200 sustained order submissions per second, a 300 requests-per-second opening burst, durable acknowledgement within 2 seconds at p99, and a payment-provider outage that can create a substantial reconciliation backlog.
Those numbers describe demand, but they do not yet show where responsibility lies or which interactions cross into systems we do not control. This lesson gives that workload a structural view. You will use system context diagrams to define the system’s scope and environment, then container diagrams to show the applications and data stores inside that scope. Along the way, you will mark trust boundaries: places where identities, administrative control, network exposure, or data-handling assumptions change.
Two views, one coherent architectural story
Architecture diagrams are communication tools, not decorative inventories of technologies. A useful diagram lets a reader answer a specific set of questions without having to infer meaning from icons, colour, or tribal knowledge.
The C4 model provides a lightweight hierarchy for this. At the two levels relevant here:
- A system context diagram treats the system being designed as a black box. It shows people and external software systems that interact with it.
- A container diagram zooms into that same system boundary. It shows its major applications and data stores, their responsibilities, and the meaningful runtime relationships among them.
A container in C4 does not mean a Docker container. It means an application or a data store: for example, a browser-based user interface, an API application, a relational database, a message topic, or an object store. A container might be independently deployable, but the key question is whether it is a meaningful runtime building block with a clear responsibility.
Read the C4 Model introduction to establish the “zoom levels” that make context and container diagrams complementary rather than competing diagrams.
In “Maps of your code,” read the mapping analogy. Then read the four short statements immediately below it, which introduce the Context, Container, Component, and Code diagram levels. For this lesson, concentrate on why Context is the broad view and Container is the first internal zoom level.
The two views must agree. If the context diagram says that the Checkout System interacts with a Payment Provider, the container diagram should still show the Payment Provider outside the Checkout System boundary. The difference is that the container diagram identifies which internal application communicates with it and why.
A system context diagram answers questions such as:
- What system are we discussing?
- Who uses it?
- Which external systems does it depend on or serve?
- What is inside the delivery scope, and what is explicitly outside it?
A container diagram answers a different set:
- Which applications and data stores comprise the system?
- What responsibility belongs to each?
- Where does important data persist?
- Which container performs each external integration?
- Which interactions cross trust boundaries?
Do not try to answer all of these questions in one “everything diagram.” A dense diagram that mixes customers, Kubernetes nodes, database tables, services, queues, cloud regions, and deployment pipelines is difficult to review because its level of abstraction keeps changing.
Begin with scope: the context diagram
A context diagram is deliberately sparse. Put one system at its centre, draw an explicit boundary around it, and name the humans and external software systems with which it has meaningful interactions.
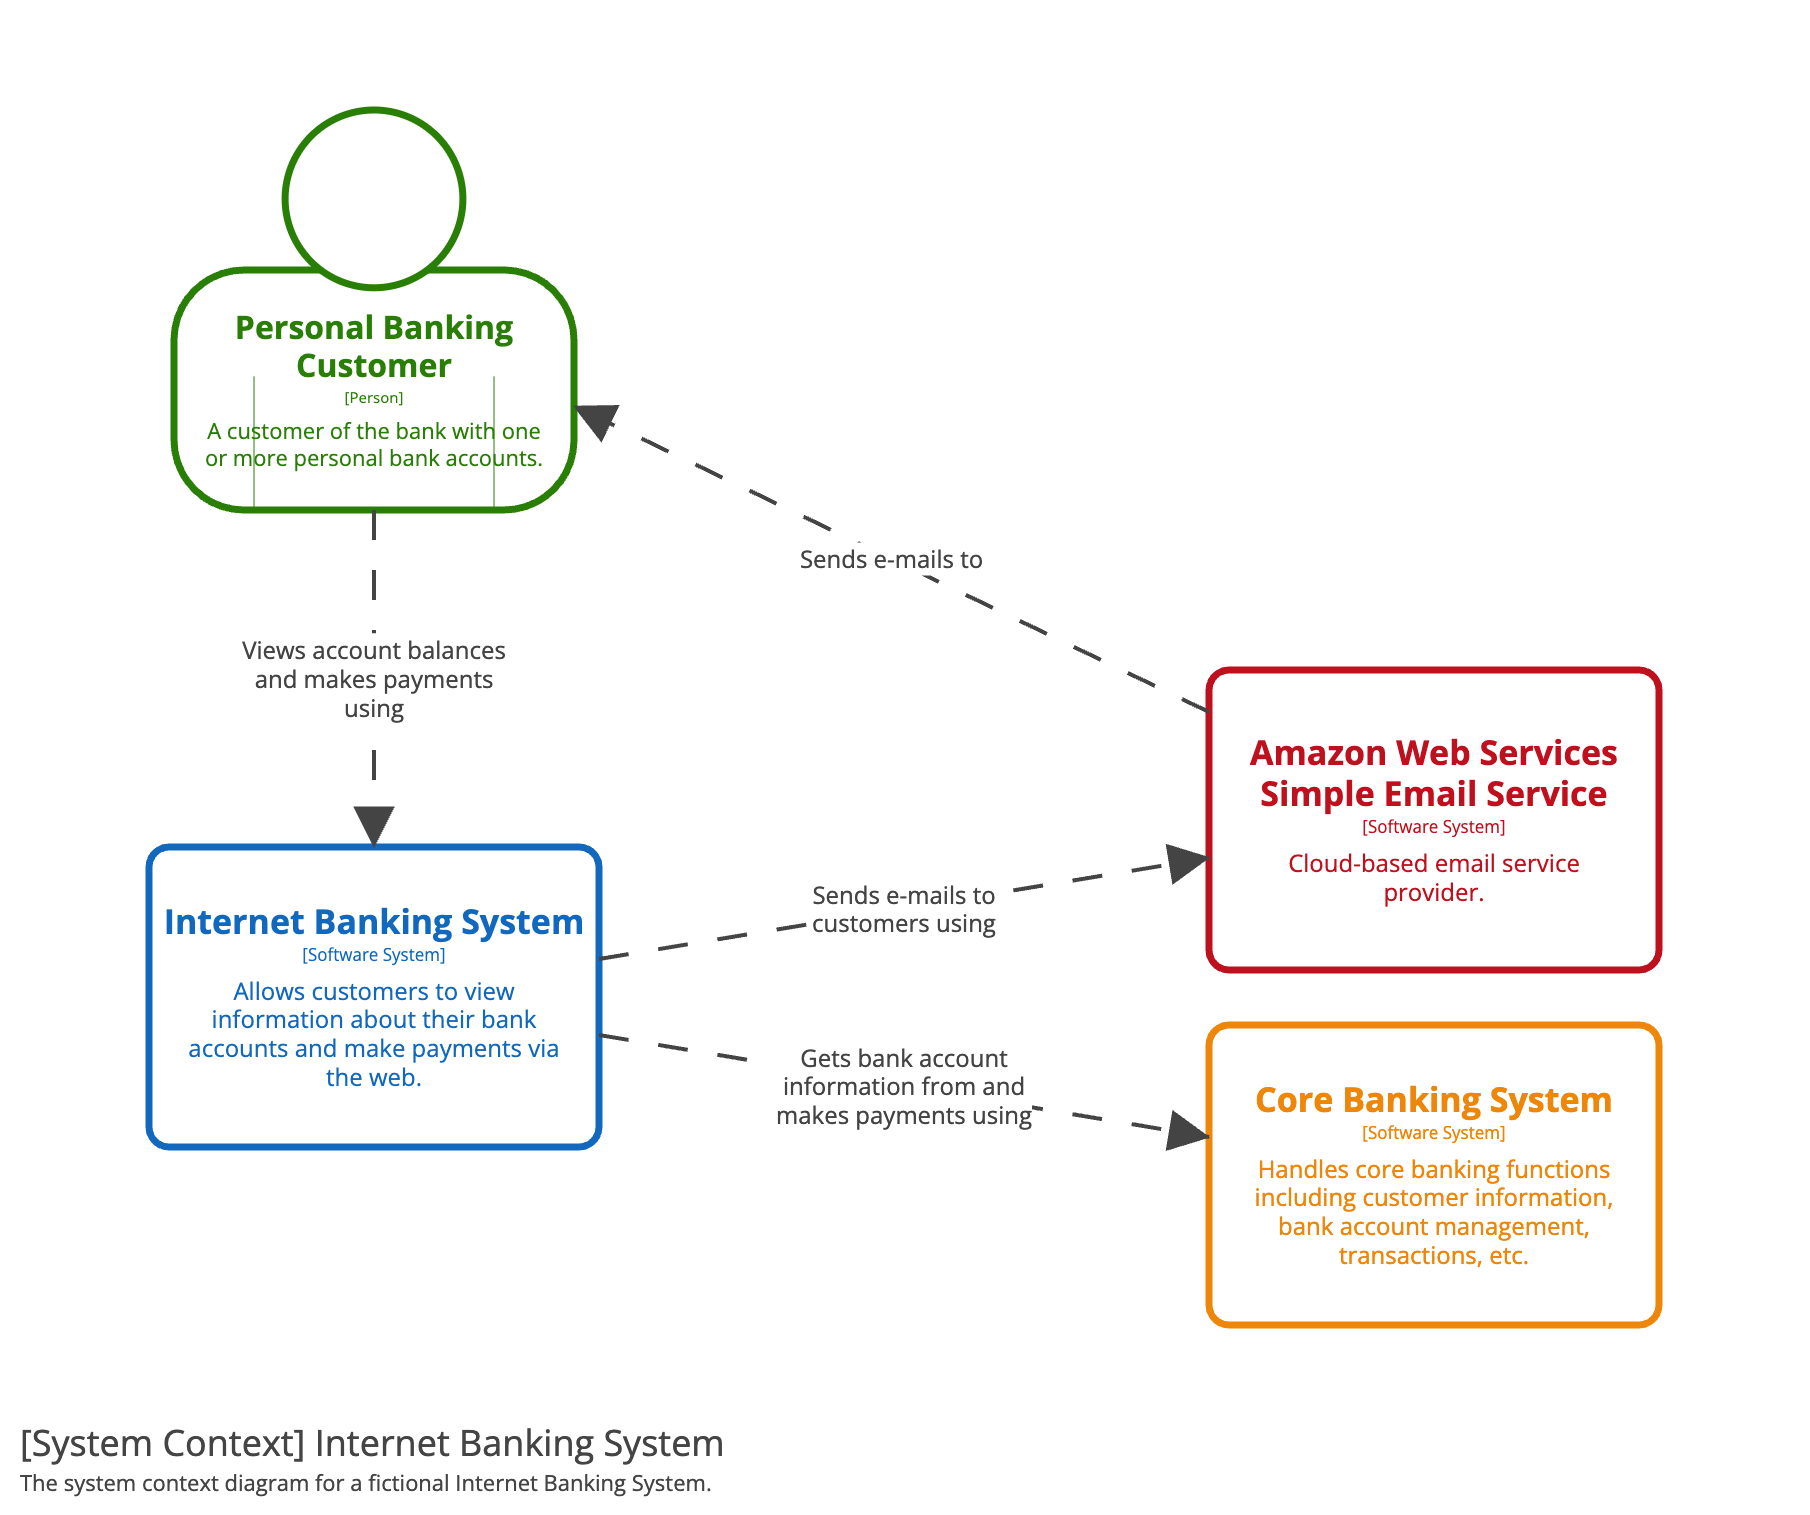
Notice what the Internet Banking context diagram does not show: databases, APIs, browser frameworks, message queues, or internal services. Those details would distract from its central claim:
Customers use the Internet Banking System; the system obtains account information and performs payments through the Core Banking System; it uses an external email service to send customer emails.
Each relationship should be readable as a short sentence. Avoid vague labels such as “connects to” or “uses.” Prefer wording that identifies the business or technical intent:
| Source | Destination | Useful relationship label |
|---|---|---|
| Shopper | Checkout System | “Submits orders and views order status using HTTPS” |
| Checkout System | Payment Provider | “Requests payment authorisation using the provider API” |
| Checkout System | Notification Service | “Requests order-status emails” |
| Fulfilment System | Checkout System | “Receives confirmed-order notifications” |
The direction should express a meaningful dependency or initiating action. You normally do not need a second line merely to show the HTTP response. Add a second relationship only when it represents a materially different interaction, such as a synchronous query in one direction and an asynchronous event in the other.
Drafting a context view for the flash-sale checkout system
Based on the earlier workload model, a credible context diagram could include:
| Element | Classification | Description for the diagram |
|---|---|---|
| Shopper | Person | Authenticated customer who browses products, submits orders, and views their order status |
| Customer Support Agent | Person | Internal staff member who investigates and manages exceptional orders |
| Flash-Sale Checkout System | Software system in scope | Accepts and records customer orders, coordinates payment processing, and exposes order status |
| Identity Provider | External software system | Authenticates shoppers and issues identity tokens |
| Payment Provider | External software system | Authorises and captures payments |
| Product Catalogue System | External software system | Provides product and price information |
| Fulfilment System | External software system | Receives confirmed orders for picking and delivery |
| Email Delivery Service | External software system | Delivers transactional emails to customers |
This is a design boundary, not an organisational chart. An external system can be owned by the same company and still be external to the system in scope. For example, the Product Catalogue System may be operated by another team; showing it externally makes its integration contract and availability dependency visible.
Equally, do not model every actor who might ever touch the system. Include a person or external system when it materially changes a responsibility, a quality attribute, an integration, or a security concern. “Customer,” “support agent,” and “payment provider” are meaningful. “The internet” is not a useful actor.
Visualising software architecture with the C4 model - Simon Brown, Agile on the Beach 2019
In Visualising software architecture with the C4 model, Simon Brown develops the same Internet Banking example from context to container level, then gives practical rules for making diagrams interpretable without narration.
Watch the context view to see how users and external dependencies establish the system’s environment. Continue with the container zoom, focusing on the questions that become appropriate only after scope is clear. For diagram craft, watch titles and layout and then relationship labels. Notice the emphasis on precise labels and on reading each connection as a sentence.
A system boundary is not automatically a trust boundary
The blue outline around a system in a C4 diagram is a scope boundary: it says, “this is the software system under discussion.” It does not by itself tell you who or what is trusted.
A trust boundary marks a transition where a security-relevant assumption changes. At such a crossing, the receiving side must not rely on the sender having the same identity, permissions, controls, network protections, or data-handling rules.
Typical reasons to draw a trust boundary include:
- A public browser or mobile application communicates with an internet-facing endpoint.
- A workload calls a third-party provider.
- A process enters a separately administered network or cloud account.
- A low-privilege workload accesses a high-value data store.
- A service accepts data from another product team or tenant.
- A human administrator uses privileged management access.
Trust is therefore not binary and not synonymous with “inside the company network.” A legacy core-banking system may be owned by the same institution, yet it can remain a separate trust domain because it has different credentials, access controls, operators, audit requirements, and highly sensitive data.
For the checkout example, a simplified set of trust zones might be:
| Zone | What belongs there | Architectural implication |
|---|---|---|
| Public-client zone | Shopper browser or mobile app | Treat all input as untrusted; authenticate requests; do not expose internal credentials or implementation details |
| Checkout workload zone | Web application, API, workers | Use distinct workload identities and narrow permissions; avoid assuming every internal container may access every resource |
| Restricted-data zone | Orders database and payment-related records | Limit network paths and database permissions; protect confidential data at rest and in transit |
| External-provider zone | Payment provider and email service | Authenticate the provider endpoint; protect credentials; define timeouts, failure handling, and data minimisation |
| Internal-operations zone | Support tools and staff access | Require stronger authentication and auditable privileged actions |
A context diagram can show these zones with clearly labelled dashed boundaries or shaded regions, provided the legend explains the convention. Do not use colour alone to communicate “trusted” versus “untrusted”: the meaning must survive printing in monochrome and be understandable to readers with different colour perception.
It is also important to keep the diagram honest. A line labelled “HTTPS” does not mean a trust boundary has been solved. Encryption in transit is one control. The crossing still needs decisions about authentication, authorisation, input validation, rate limits, secrets, logging, and what data is appropriate to disclose.
Create architecture design diagrams - Azure
This Azure Well-Architected guidance distinguishes context and high-level system diagrams, then explains why a data-flow view is often the right complement when security analysis requires more detail.
Read “Context diagram” and “High-level system or container diagram” first, focusing on the distinction between a black-box scope view and a decomposition into major internal building blocks. Then read the “Data-flow diagram (DFD)” subsection through the threat-modeling role. The key distinction is that C4 diagrams can expose trust crossings, while a security DFD may later analyse those crossings in greater depth.
A context or container diagram is not a replacement for a threat model. It is the map that makes threat modelling possible. In the security module, you will use trust boundaries to systematically identify attack paths and mitigations. For now, the goal is to expose the boundaries rather than silently assuming them away.
Zoom in: the container diagram
Once stakeholders agree on the context, retain the same system boundary and zoom into it. The container diagram replaces the central black box with the system’s major applications and data stores. It also retains the important people and external systems from the context diagram, so readers can follow an end-to-end responsibility.
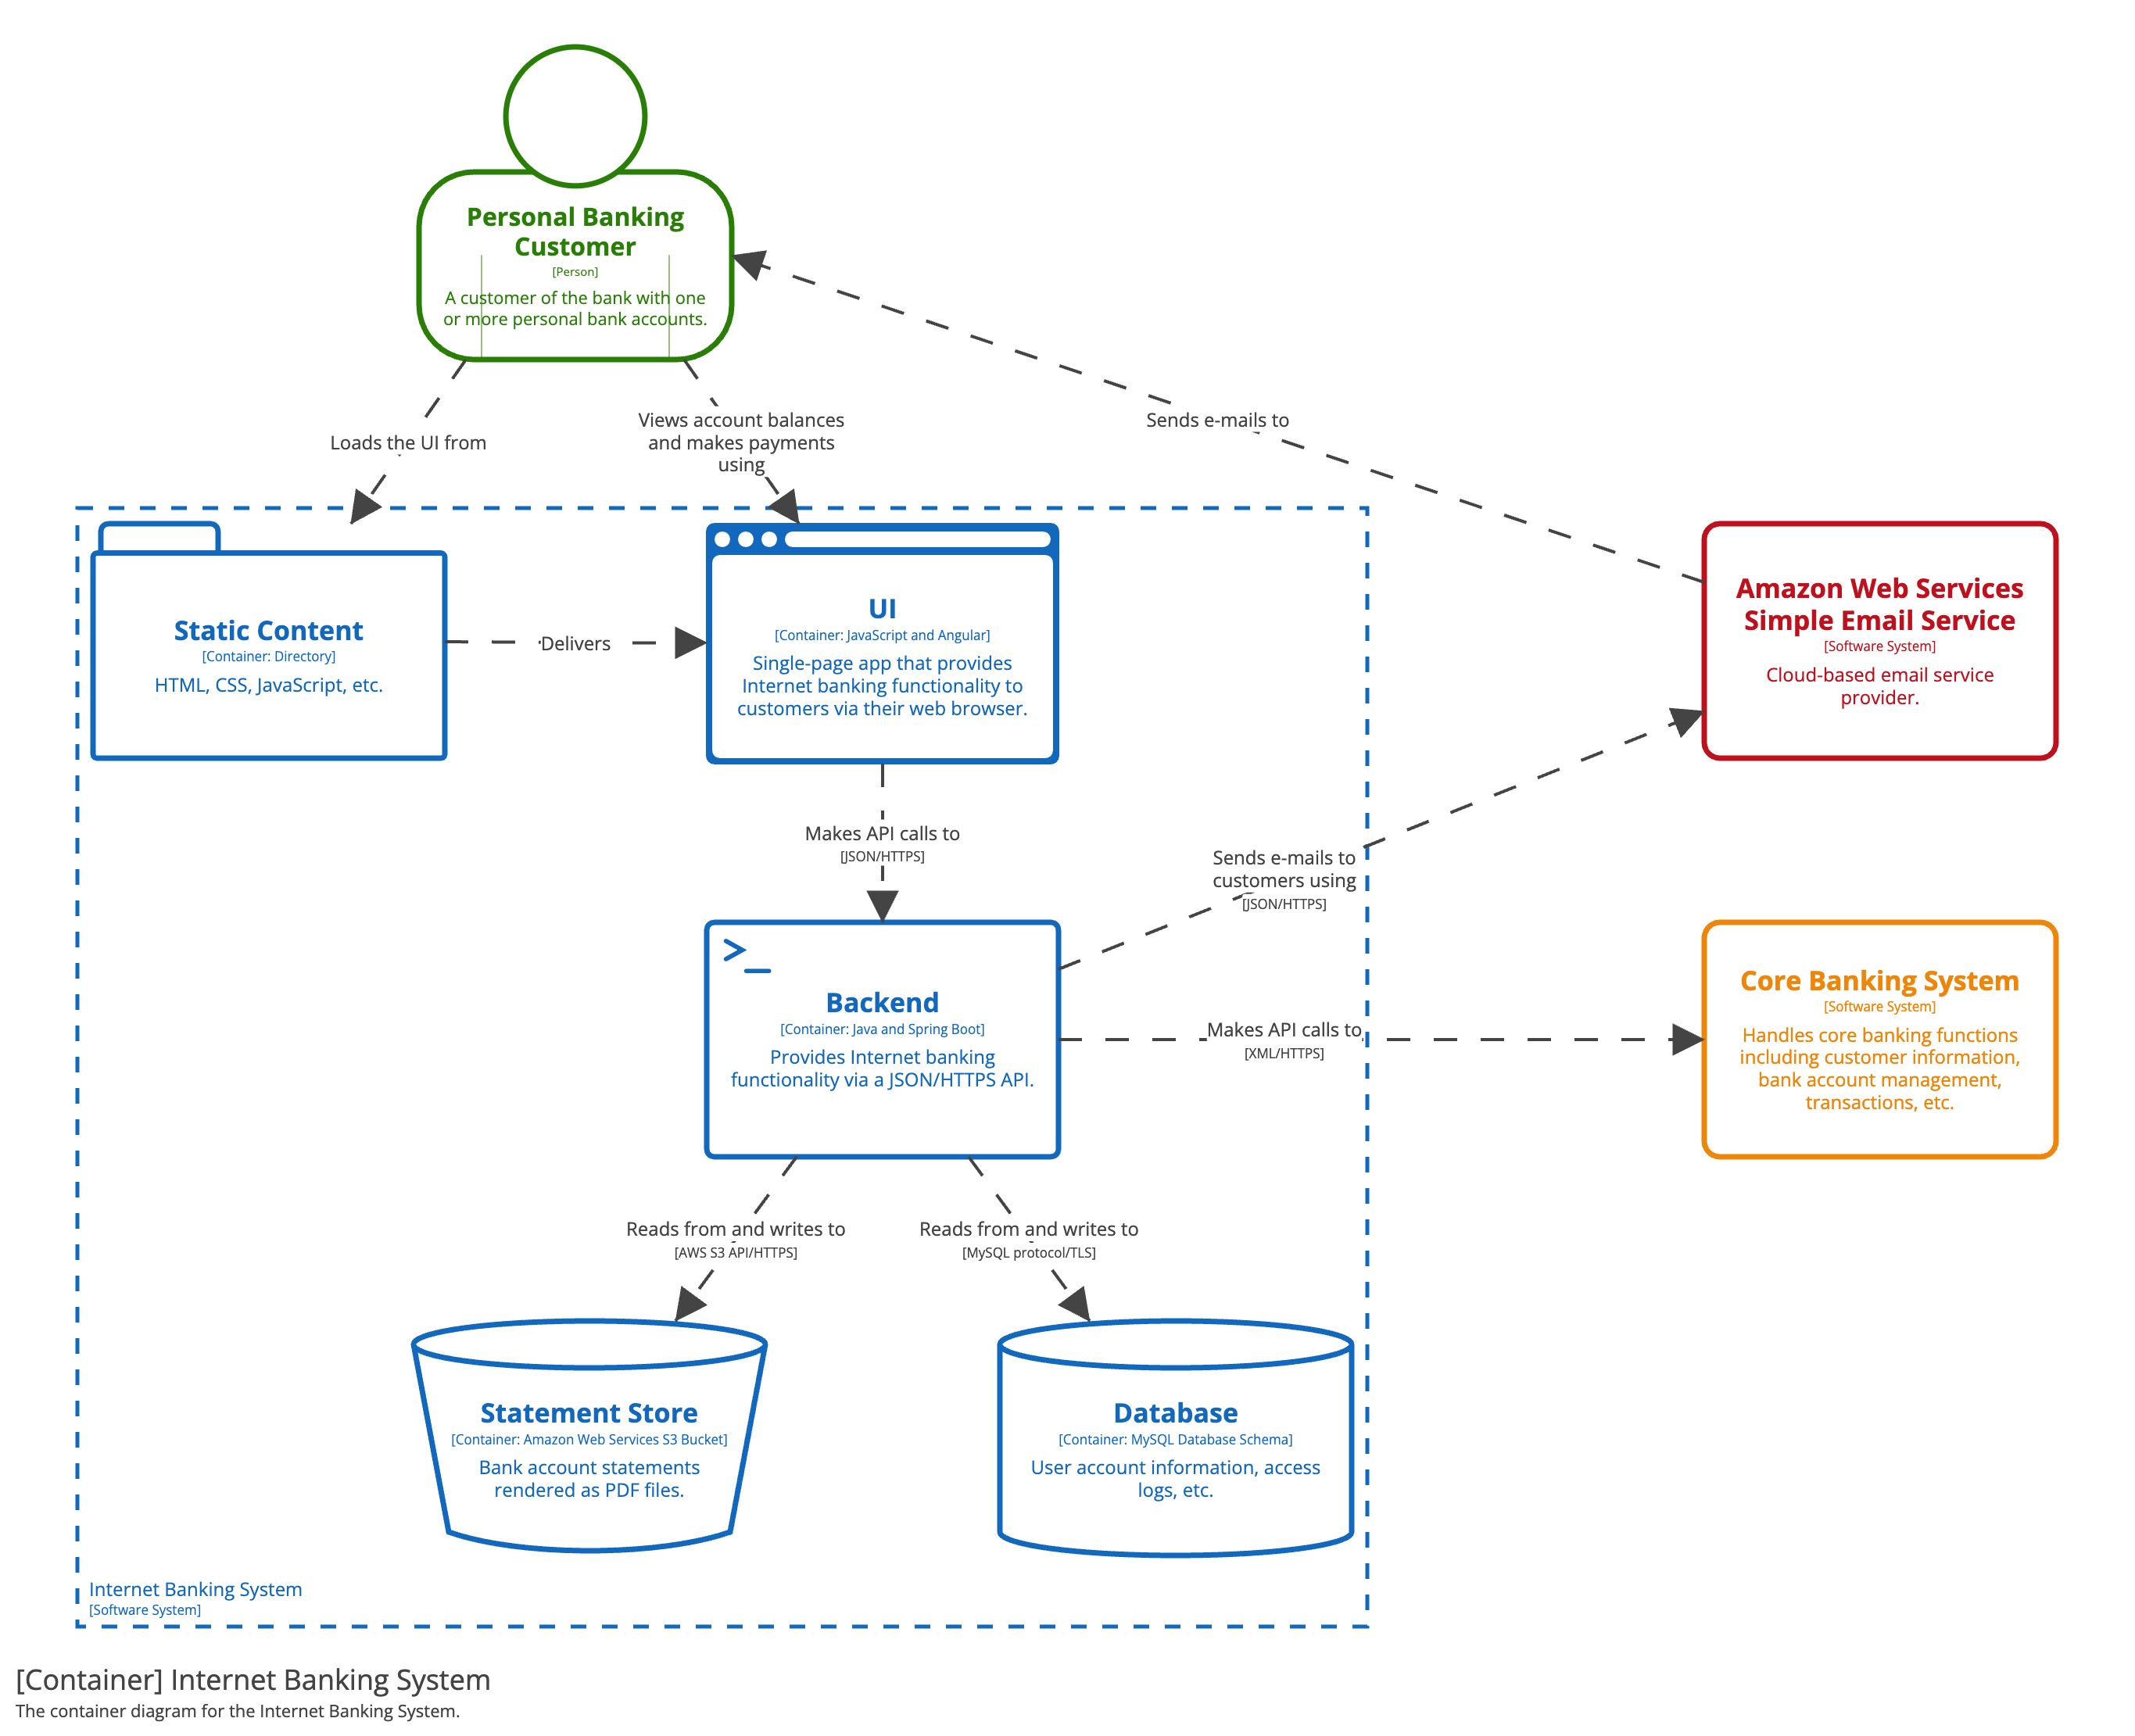
The image shows several useful conventions:
- Every box has a responsibility. “Backend” is not merely a label; its description states that it provides banking functionality through a JSON/HTTP API.
- Data stores are first-class containers. The Database holds user account information and access logs; the Statement Store holds rendered statements. These are different responsibilities and potentially different protection requirements.
- Technology is supporting information, not the whole diagram. Readers can see technologies such as Java, Spring Boot, and MySQL, but they can still understand the diagram without being experts in each tool.
- External dependencies remain visible. The Core Banking System does not disappear simply because the diagram has zoomed inside the Internet Banking System.
- Relationships have intent. “Makes API requests,” “reads from and writes to,” and “sends emails” are all more informative than “uses.”
For the flash-sale checkout system, consider this illustrative container model. It is a representation of one possible responsibility allocation, not yet a decision that this is the best architecture.
| Container | Type | Primary responsibility | Important interactions |
|---|---|---|---|
| Checkout Web UI | Browser application | Presents checkout, collects customer input, and displays acknowledgement or payment status | Communicates with Checkout API; obtains identity tokens from Identity Provider |
| Checkout API | Server-side application | Validates requests, applies checkout rules, accepts orders durably, and exposes order status | Reads and writes Orders Database; places payment work for processing |
| Orders Database | Data store | System of record for orders, order state, and audit-relevant checkout data | Accessible only to authorised checkout workloads |
| Payment Work Queue | Durable message store | Holds accepted payment work while processing is delayed or a provider is unavailable | Written by Checkout API; consumed by Payment Worker |
| Payment Worker | Server-side application | Requests payment authorisation and reconciles pending orders | Reads payment work; calls Payment Provider; updates order state |
| Order Events Topic | Durable message store | Publishes facts such as an order becoming confirmed | Written by checkout workloads; consumed by notification and fulfilment integrations |
| Notification Worker | Server-side application | Requests customer communications about accepted, confirmed, or failed orders | Consumes order events; calls Email Delivery Service |
This model connects directly to the workload model:
- The Checkout API is on the critical user journey and must acknowledge eligible orders durably within the stated p99 target.
- The Payment Work Queue makes visible where the estimated 180,000 pending orders could accumulate during a 15-minute provider outage.
- The Payment Worker has a different workload from the checkout API: it must process both ongoing demand and recovery backlog.
- The Orders Database is the source of durable truth, so it carries the strongest integrity and availability requirements.
- The Order Events Topic separates a confirmed-order fact from downstream work such as fulfilment or notification. Its consumers can have independently measured processing rates.
This is why a container diagram should not begin with technologies. Start with responsibilities and important data, then add the applications and stores that own those responsibilities. Otherwise, a technology choice can accidentally become the system’s organising principle.
Representing trust boundaries at container level
A container diagram can identify the same broad trust zones as the context diagram, now with more precision:
| Crossing | What changes at the boundary | What the diagram should make visible |
|---|---|---|
| Browser to Checkout API | Untrusted client input reaches a public service | Public API entry point; authenticated request relationship; HTTPS or another chosen protocol |
| Checkout API to Orders Database | Application identity seeks access to sensitive persisted data | Database boundary; restricted access relationship; ownership of order data |
| Payment Worker to Payment Provider | Internal workload enters a third-party environment | Provider dependency; payment-specific workload identity; outbound API relationship |
| Notification Worker to Email Service | Customer contact data crosses to a provider | Email dependency; minimum necessary message content |
| Support Agent to Support Interface | Privileged human access changes order data or visibility | Separate administrative user and support-facing application, if it is in scope |
A diagram need not list every security control on every connection. That would become a security design document rather than a container view. Instead, mark the crossings and include only the annotations that clarify an architectural decision: protocol, public exposure, asynchronous messaging, sensitive data classification, or a separate administrative zone.
When deeper security analysis is needed, create a focused data-flow diagram for one scenario, such as “shopper submits order” or “support agent refunds order.” That focused view can name data classifications, authentication mechanisms, encryption requirements, and threats without overloading the C4 diagrams.
A disciplined drafting routine
Use the following routine when creating a pair of diagrams for a new system or a materially changed architecture.
1. Write a one-sentence scope statement
For example:
The Flash-Sale Checkout System accepts customer orders, records their status, and coordinates payment and fulfilment integrations; product catalogue management and payment processing remain outside its delivery scope.
This sentence prevents scope from drifting while you draw.
2. Create the context diagram first
Include:
- the system in scope, with a short purpose statement;
- distinct user roles whose needs or permissions differ;
- external systems that exchange meaningful information with it;
- labelled, directional relationships;
- an explicit system boundary;
- trust zones or crossings where they are essential to the discussion.
Keep internal services out of this view. If a stakeholder asks “Which service talks to the payment provider?”, that is a signal to move to the container diagram, not to add more boxes to the context diagram.
3. Expand only the system in scope
Replace the central system box with applications and data stores. For each container, write:
- a clear name;
- its type, such as browser application, server-side application, database, object store, or message topic;
- a concise responsibility statement;
- an optional technology choice when that choice matters to the reader.
A quick test is to cover the box title with your hand. The remaining text should still make its purpose understandable.
4. Add relationships that explain runtime responsibility
Label relationships with an action and, when relevant, a protocol or interaction style:
- “Submits checkout requests using HTTPS”
- “Reads and writes order state using SQL”
- “Publishes confirmed-order events”
- “Consumes payment work”
- “Requests payment authorisation using provider API”
A container diagram shows a structural, runtime view. It is not the place to depict every retry, every response payload, or exact temporal ordering. Those details belong in later interaction and failure-analysis views.
5. Review every boundary crossing
For each line that crosses a trust boundary, record a short architectural prompt alongside the diagram:
- What identity does the caller present?
- What data crosses, and is all of it necessary?
- Which side validates the data?
- What permissions are required?
- Which party operates and monitors the endpoint?
- What happens when the dependency is slow, unavailable, or compromised?
The diagram does not need to answer all of these immediately. Its job is to ensure that the questions are visible and assigned.
6. Apply a readability check
Before treating the diagrams as architectural artifacts, verify that they have:
- a precise title, such as “System Context: Flash-Sale Checkout System”;
- a stated scope boundary;
- consistent names across both diagrams;
- a small legend if colours, line styles, or boundary styles have meaning;
- no unexplained domain acronyms;
- relationship labels that can be read aloud as coherent sentences;
- enough text to explain responsibilities without turning boxes into paragraphs.
One final rule is especially valuable: do not let a diagram claim certainty you do not have. If it is not yet known whether payment is synchronous, asynchronous, or handled through a provider-hosted flow, label that as an assumption or show alternative diagrams. An accurate incomplete diagram is better than a polished fiction.
Key takeaways
A system context diagram establishes the boundary of the system under discussion. It shows people, external software systems, and high-level interactions while deliberately hiding internal structure.
A container diagram expands that same boundary into major applications and data stores. Each container should have a clear responsibility, and each relationship should explain a meaningful runtime interaction.
A scope boundary answers what belongs to the system being designed. A trust boundary identifies where security-relevant assumptions change: for example, between a public client and an API, a workload and a restricted data store, or an internal service and a third-party provider. The two often overlap, but they are not the same thing.
Together, these diagrams give the workload model from the previous lesson a structural home: you can see where 200 checkout requests per second arrive, where durable order data lives, where outage backlog accumulates, and which dependencies create reliability and security risks.
Next, you will document architectural assumptions explicitly and identify the risks that arise if those assumptions prove false.
Can't find a good explanation? Sign up and we'll make it for you
Sign up