
Hello! Let's continue our exploration of the somatic nervous system.
In our last lesson, we established the crucial difference between surface EMG (sEMG) and intramuscular EMG (iEMG). We concluded that for your work at Neuraease and the world of wearable technology, non-invasive sEMG is the method of choice. Now, the question becomes: how do we actually build a device to capture and make sense of these signals?
This lesson directly addresses that question, fulfilling the learning outcome: Design an EMG acquisition system and apply signal processing (rectification, integration) to quantify muscle activity. We will break down the essential hardware components and then walk through the software processing steps needed to turn a raw, noisy signal into a quantifiable measure of muscle tension.
1. EMG Signal Characteristics: Know Your Target
Before designing any system, we must understand the signal we're trying to measure. As we've discussed, the EMG signal is the sum of many Motor Unit Action Potentials. When measured on the skin (sEMG), it has very specific characteristics.
The 'EMG Robot Arm' document provides a concise summary of the key electrical characteristics of the sEMG signal that drive our entire design process.
Please read the short section 2, 'EMG Signal Measurement' (page 3). Pay close attention to these three critical points: Frequency Range: What is the typical frequency content of an sEMG signal? Signal Magnitude: How small is the signal voltage we need to capture? Processing Goal: What form of the signal is ultimately most useful for control or analysis?
From that reading, we can extract the core design challenges:
- Amplitude: The signal is tiny, in the range of 100–1000 microvolts (µV). This demands significant amplification. A gain of 1000 to 5000 is common to bring the signal into the volt range for an Analog-to-Digital Converter (ADC).
- Frequency: The useful energy is concentrated between approximately 5-500 Hz. We need to design filters to isolate this band, rejecting everything else as noise. This includes low-frequency motion artifacts and high-frequency noise.
- Nature: The raw signal is an alternating, noisy waveform that averages to zero. We need to process it to extract a meaningful measure of intensity or activity.
2. Designing the EMG Acquisition System
An EMG acquisition system can be broken down into a series of functional blocks, a concept that should be familiar from your ECE background. Let's watch a video that outlines these blocks before we dive into the circuit-level details.
Electromyography (EMG) Sensors and Signal Processing
The video 'Electromyography (EMG) Sensors and Signal Processing' provides a great overview of the components of an EMG system.
Watch from 02:55 to 04:08. The video presents a clear block diagram. Identify the key stages: muscle, electrode array, amplifier, filter, and ADC.
Now, let's design each of these electronic stages.
Stage 1: Amplification
Given the microvolt-level signal, our first and most important task is amplification. However, we're not just dealing with a small signal; we're dealing with a small differential signal in the presence of much larger common-mode noise (like 50/60 Hz power line hum that is picked up by the whole body).
This is the classic scenario for an Instrumentation Amplifier (In-Amp). An In-Amp is a specialized differential amplifier circuit optimized for:
- High Common-Mode Rejection Ratio (CMRR): It brilliantly rejects noise that is common to both input electrodes, while amplifying only the tiny voltage difference between them, which is our EMG signal.
- High Input Impedance: It draws almost no current from the electrodes, preventing distortion of the biological signal.
- Stable, Adjustable Gain: The gain is typically set with a single external resistor.
Stage 2: Filtering
After amplification, we must filter the signal to keep the desired 5-500 Hz band. This is usually done with a band-pass filter.
- High-Pass Filter (HPF): Set with a cutoff around 5-30 Hz. Its main job is to remove the DC offset from the electrode-skin interface and, critically, to eliminate low-frequency motion artifacts caused by the electrodes or cables moving.
- Low-Pass Filter (LPF): Set with a cutoff around 450-500 Hz. This removes high-frequency noise and also serves as an anti-aliasing filter before the signal goes to the ADC.
A Complete EMG Circuit
The image below shows a detailed circuit diagram for a high-quality EMG acquisition front-end. You can see how the theoretical blocks are realized with specific components.

While complex, you can trace the signal path:
- The differential signal from the electrodes (
J2,J3) enters the Instrumentation Amplifier (U1: INA126P). - The amplified signal goes through a High-Pass Filter.
- It then passes through a Low-Pass Filter.
- The final output (
J7) is a clean, amplified EMG signal ready for the ADC.
This hardware front-end is the foundation for getting a usable signal.
3. Signal Processing: Quantifying Muscle Activity
The signal coming from our hardware is a clean, raw EMG waveform. But as we noted, it's still a rapidly fluctuating AC signal. To quantify "how much" a muscle is contracting, we need to process it further. This is typically done in software after the ADC stage.
The following image provides a perfect visual summary of the process.
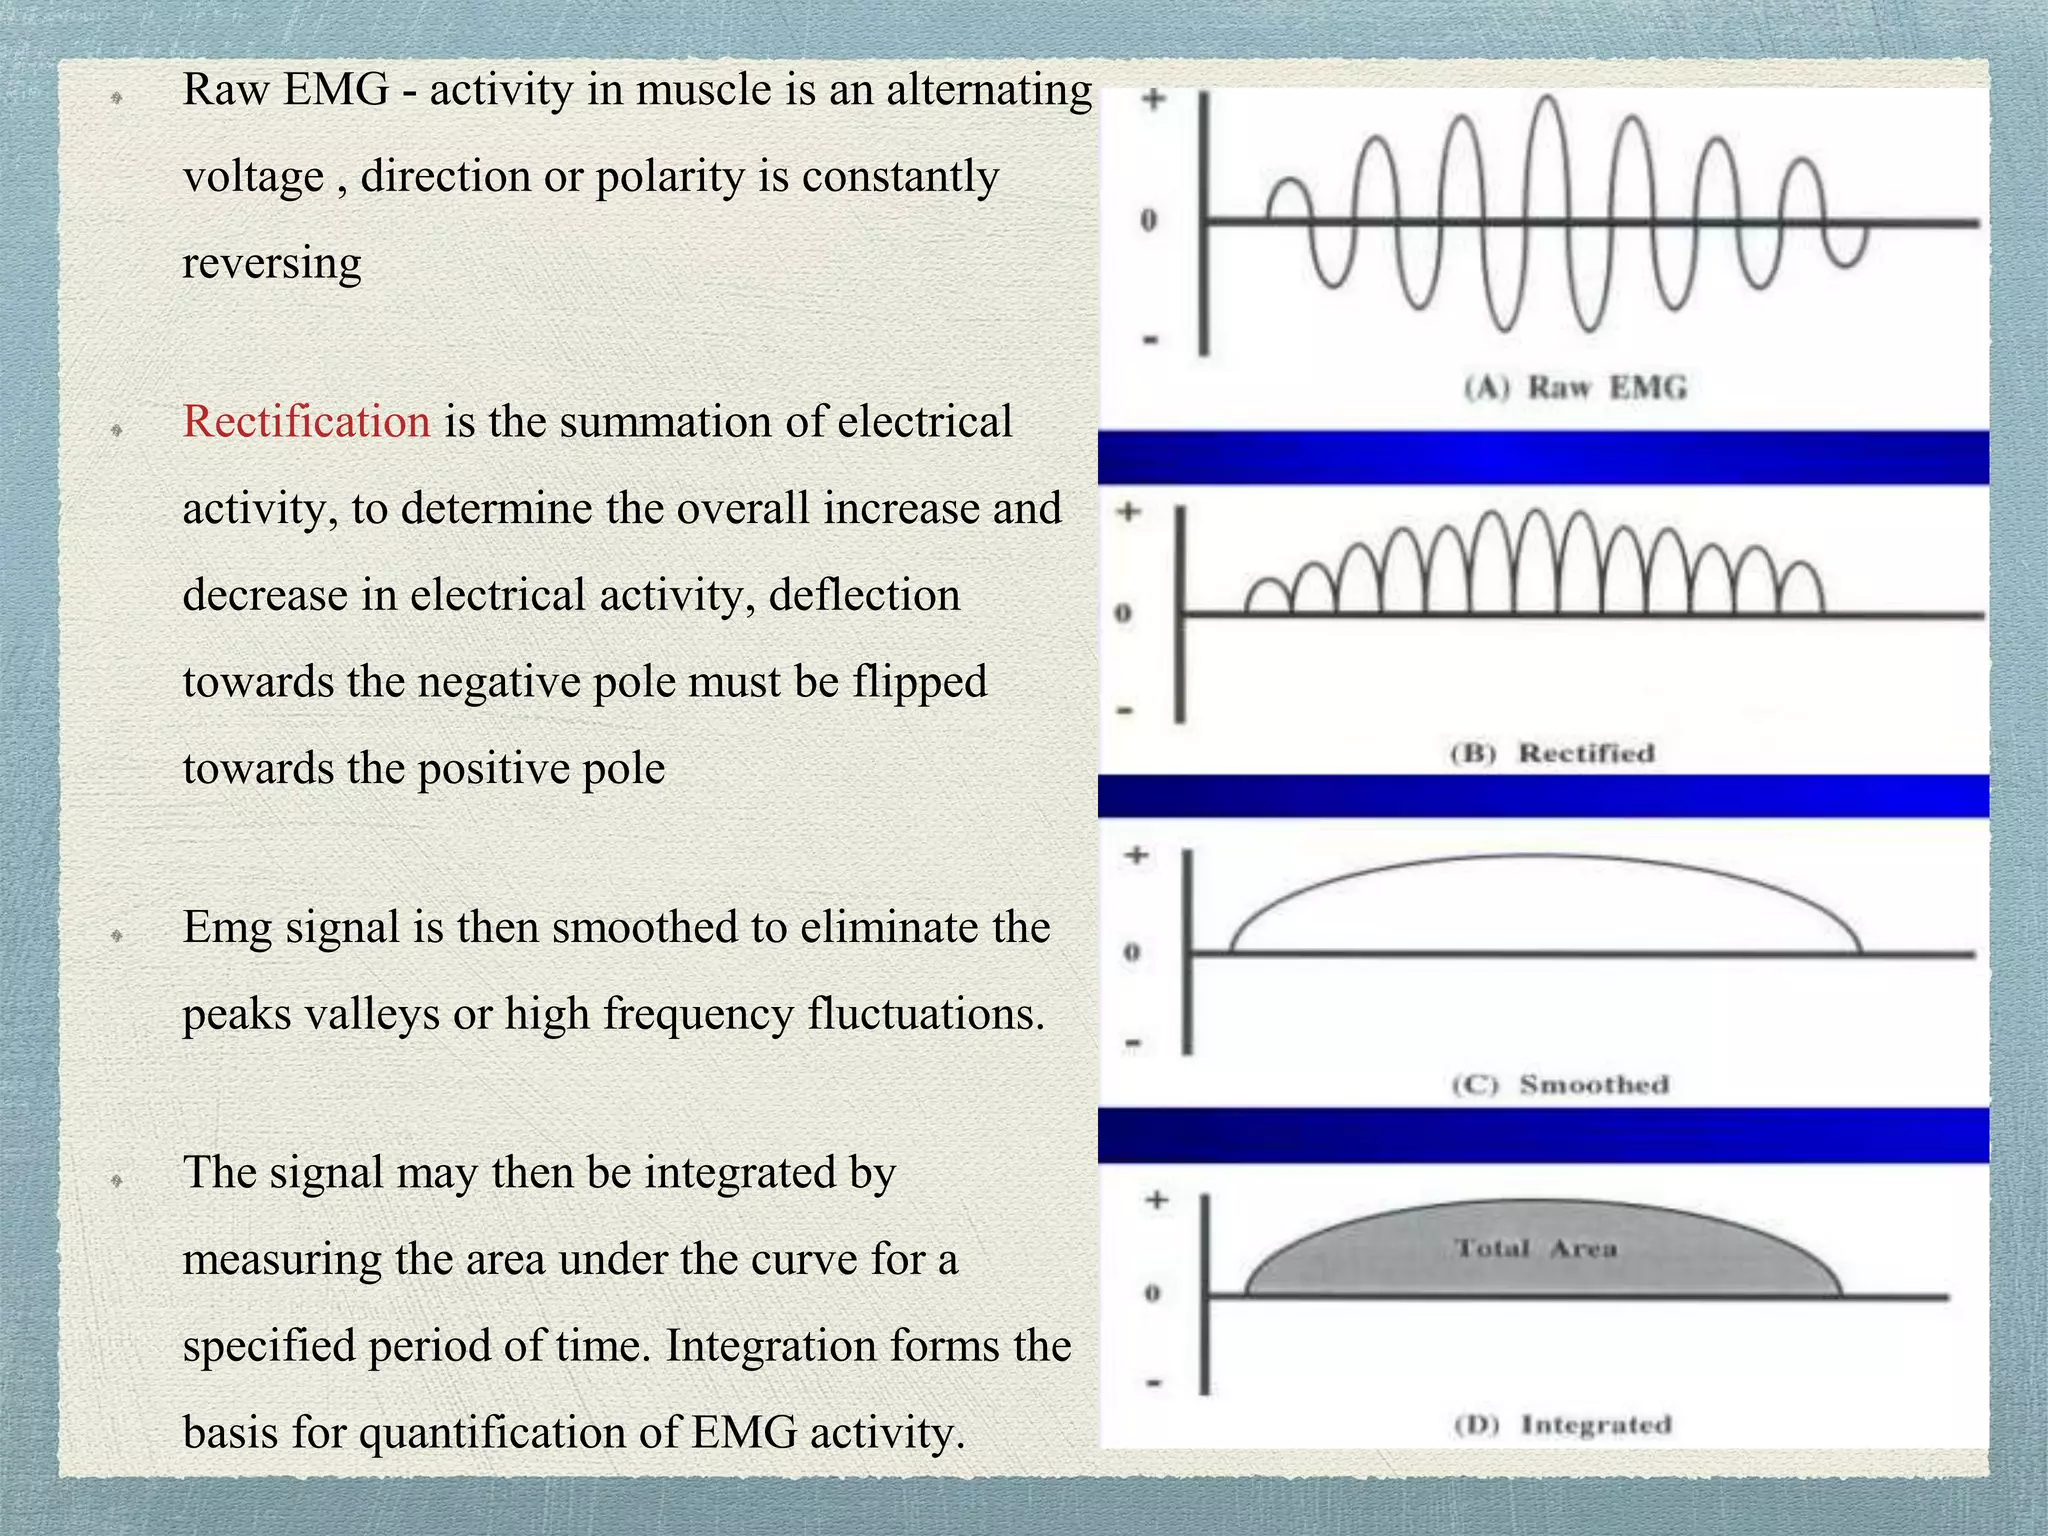
Let's break down these steps.
Step 1: Rectification
The raw EMG signal has both positive and negative values. If you average it over time, you'll get a value close to zero, which isn't useful. The first step is full-wave rectification, which simply means taking the absolute value of the signal. This flips all negative parts to be positive, ensuring all energy contributes to the final measure.
Rectified_EMG = |Raw_EMG|
Step 2: Smoothing and Integration
The rectified signal is still very spiky and hard to interpret. We need to smooth it to get a clear measure of the muscle activity's intensity, often called the EMG envelope. The learning outcome mentions two approaches: integration and smoothing.
-
Integration: This method involves calculating the area under the rectified EMG curve over a specific time window (an epoch). The result is the "Integrated EMG" (IEMG), a single number representing the total muscle activity during that window. It's useful for comparing activity between discrete phases (e.g., lift phase vs. lower phase).
-
Smoothing (RMS Envelope): A more common and powerful method for real-time analysis is to calculate the Root Mean Square (RMS) value within a moving window. This gives you a continuous, smooth line that represents the signal's power or intensity over time. For a wearable device like yours, the RMS envelope is exactly what you need to track moment-to-moment changes in muscle tension.
The choice of the window size for the moving RMS is a critical design decision involving a trade-off.
EMG Signal Processing: Key Techniques and Practical ...
The article 'EMG Signal Processing' from Noraxon, a leading manufacturer of EMG systems, gives excellent practical advice on choosing a smoothing window.
Please read the section 'Smoothing: Making Sense of EMG Amplitude', including the table and the practical examples for running. Focus on the trade-off described: what do you gain and lose with a short window vs. a long window?
As the article explains:
- A short window (e.g., 50 ms) provides better timing precision, allowing you to detect rapid changes in muscle activation.
- A long window (e.g., 300 ms) provides a smoother signal that's better for assessing average activity level during quasi-static tasks.
Test your understanding!
For your startup Neuraease, you want to use sEMG from the upper trapezius muscle (a shoulder muscle) to detect two different stress-related behaviors for a meltdown warning system:
- A sudden, quick muscle "jerk" or flinch.
- A slow, steady increase in muscle tension over several seconds.
How would your choice of RMS smoothing window size differ for these two detection goals?
Show answer
- For the sudden jerk: You would need a short RMS window (e.g., 30-50 ms). This prioritizes timing precision, ensuring you can capture the rapid onset and short duration of the flinch without smoothing it away.
- For the slow tension increase: You would use a longer RMS window (e.g., 250-500 ms). This prioritizes a smooth, stable signal, making it easier to see the underlying trend of increasing activation without being distracted by noisy, moment-to-moment fluctuations. A longer window effectively acts as a low-pass filter on the activity level itself.
Conclusion
Today, we've designed a complete sEMG system from the ground up. We saw how fundamental ECE principles are applied to solve the specific challenges of measuring microvolt-level biological signals. The final RMS envelope is the key—it's a clean, quantitative signal that you could feed directly into a machine learning model to classify states like "relaxed," "tense," or "active."
Key Takeaways:
- An sEMG acquisition system consists of an Instrumentation Amplifier for high-gain, high-CMRR amplification, followed by a band-pass filter (typically 20-500 Hz) to isolate the signal.
- The raw EMG signal must be processed to be useful. The standard workflow is Rectification (taking the absolute value) followed by Smoothing.
- RMS (Root Mean Square) in a moving window is the most common smoothing method. It produces an "EMG envelope" that quantifies muscle activity intensity over time.
- The choice of smoothing window size is a critical trade-off between timing precision (short window) and signal smoothness (long window).
Preview of the Next Lesson:
We've now covered a key indicator from the somatic nervous system (EMG). Next, we will turn to a cornerstone of autonomic nervous system measurement, which is highly relevant to tracking stress and arousal: Electrodermal Activity (EDA). We will explore its physiological basis and its relationship to sympathetic nervous system activity.
Can't find a good explanation? Sign up and we'll make it for you
Sign up