
Hello, and welcome to biology. This course begins with a skill that underlies nearly every biological claim you will encounter: figuring out what an experiment actually tested. Before studying cells, genetics, or ecosystems, you need to be able to separate the factor a scientist changed from the result they measured—and recognize what makes a comparison fair.
In this lesson, you will learn to identify the independent variable, dependent variable, control group, and constants (also called controlled variables) in a biology experiment. By the end, you should be able to read a short experiment description and label each part confidently.
The basic logic of a fair experiment
An experiment asks whether changing one factor makes a difference to an outcome. For example:
Does the amount of water a bean seed receives affect whether it germinates?
Many factors could affect germination: water, light, temperature, soil, seed type, and time. A useful experiment changes one chosen factor while keeping the other important conditions as similar as possible.
Here are the four labels you need.
| Part of an experiment | Meaning | Useful question to ask |
|---|---|---|
| Independent variable | The factor the researcher deliberately changes or assigns. | “What did the scientist change between groups?” |
| Dependent variable | The outcome the researcher observes or measures. | “What result did the scientist record?” |
| Control group | The comparison group under baseline or normal conditions; it does not receive the experimental change. | “What would happen without the tested treatment?” |
| Constants / controlled variables | Conditions kept the same across groups so they cannot explain the result. | “What was deliberately held equal?” |
A helpful way to state the relationship is:
The names describe each variable’s role in the experiment, not whether it can ever be influenced by anything else in the real world. For instance, plant height depends on many conditions in nature. But if an experimenter changes only light type and measures height, then light type is the independent variable and height is the dependent variable in that experiment.
Independent, Dependent and Controlled Variables
Watch “Independent, Dependent and Controlled Variables” from Science Ready for a compact introduction to the three types of variables and a plant-growth example.
Watch the overview to hear what scientists mean by a variable. Then watch independent and dependent variables, focusing on the difference between what is changed and what is measured. Finish with the plant example; pause when the narrator lists soil, sunlight, and temperature, and sort them into independent variable, dependent variable, or constants.
Groups are not variables
A common source of confusion is mixing up a control group with a controlled variable. They are different things.
A group is a set of organisms, samples, or people receiving the same condition. A variable is a characteristic or condition that can differ.
Suppose scientists test whether a new fertilizer affects tomato-plant growth.
- The experimental group receives the new fertilizer.
- The control group receives no fertilizer, or receives the usual standard fertilizer treatment.
- The independent variable is fertilizer treatment.
- The dependent variable might be plant height after four weeks.
- Constants could include tomato variety, pot size, soil amount, light exposure, watering schedule, temperature, and experiment length.
The control group gives the experimental result meaning. If fertilized plants grow 5 cm, that number alone does not tell us much. Perhaps all plants would grow 5 cm in four weeks anyway. Comparing their growth with an otherwise similar control group lets scientists judge whether the fertilizer is associated with an additional difference.
A control group does not always receive “nothing.” In medicine, for example, it may receive an inactive placebo or the currently accepted treatment. The essential idea is that it provides a baseline comparison without the new experimental change.
Read the following explanation to consolidate these distinctions.
3.14: Experiments and Hypotheses - Biology LibreTexts
Read Biology LibreTexts’ “Experiments and Hypotheses.” It explains why experiments need comparable experimental and control groups, then gives clear definitions of independent, dependent, and control variables.
First, in the discussion before the subsection “Experimental Variables,” read the group comparison. Focus on why a control group must be similar to the experimental group except for the treatment being tested. Then read the subsection “Experimental Variables.” Begin with what a variable is. Next, read the independent-variable explanation and the dependent-variable explanation. Notice the emphasis on making a dependent variable measurable rather than vague.
Reading a complete biology experiment
Now apply the labels to the bean-seed experiment below. The research question is:
Does water affect bean-seed germination?
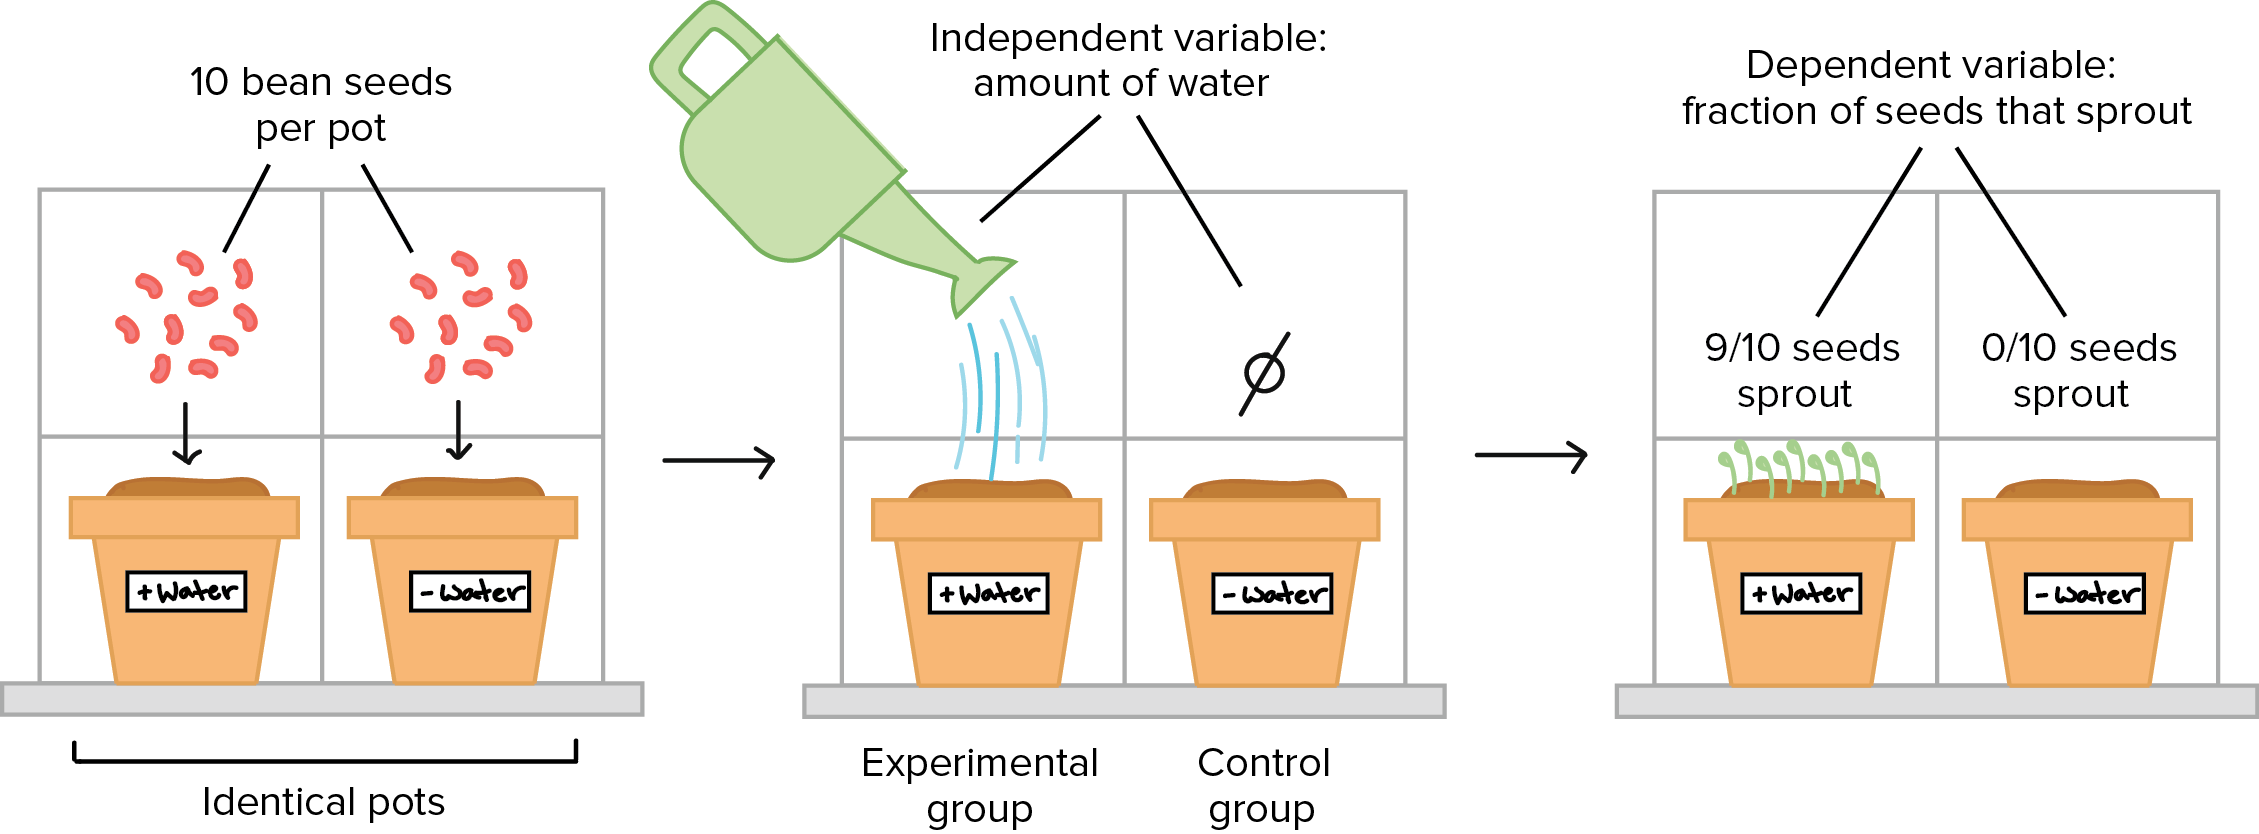
Start with the part the researcher intentionally made different. One pot receives water and the other does not. Therefore, the independent variable is the water condition—more specifically, whether the seeds receive water. The image calls it “amount of water”; in this particular setup, the two levels are water versus no water.
Next, find what was measured after the treatment. The investigators count how many seeds sprout:
- Watered pot: 9 out of 10 seeds sprout.
- Unwatered pot: 0 out of 10 seeds sprout.
So the dependent variable is the fraction of seeds that sprout, also called the germination rate. Notice how specific that is. “Seed success” would be vague; “number or fraction of seeds germinated after a set time” can be observed and recorded.
The group that receives the changed condition, water, is the experimental group. The group without water is the control group. It shows what happens under the baseline condition for this particular question.
Finally, look for conditions the diagram keeps the same:
- 10 bean seeds per pot
- identical pots
- presumably the same bean type
- the same soil and soil amount
- the same location, light, temperature, and duration of the experiment
These are constants. They matter because a result is hard to interpret if groups differ in more than the one condition being tested. If the watered seeds were also kept in a warm sunny room while the unwatered seeds were put in a cold dark room, water would no longer be the only plausible explanation for the difference. Light and temperature would be confounding variables: extra differences that could influence the outcome.
In real research, scientists usually use many seeds and repeat trials rather than relying on one pot per condition. Natural variation still exists even when conditions are controlled. Replication helps researchers decide whether a pattern is reliable rather than a coincidence. But the central design rule remains the same: make groups comparable, deliberately vary the independent variable, and measure a defined dependent variable.
A reliable identification routine
When you meet an unfamiliar experiment, do not try to memorize labels by guessing from individual words. Instead, reconstruct what the scientists did.
-
State the research question.
Rephrase it as “How does ___ affect ___?” -
Find the deliberate change.
The first blank is usually the independent variable. -
Find the recorded outcome.
The second blank is usually the dependent variable. Look for a measurable quantity such as mass, number, rate, height, survival, or concentration. -
Locate the baseline comparison.
This is the control group. Ask which group did not receive the new treatment or altered condition. -
List other relevant conditions.
If they were kept equal across groups, they are constants. If they differ unintentionally, they are possible confounding variables.
Consider this short example:
A scientist tests whether temperature affects yeast fermentation. Three flasks contain equal amounts of the same yeast-and-sugar mixture. The flasks are kept at different temperatures for 30 minutes. The scientist measures the volume of carbon dioxide gas produced.
Using the routine:
- Independent variable: temperature
- Dependent variable: volume of carbon dioxide produced in 30 minutes
- Constants: yeast type and amount, sugar solution, flask size, experiment duration, and measurement method
- Control group: not necessarily stated. If one flask is held at a normal or standard temperature chosen as a baseline, that flask functions as the control group. The other temperatures are experimental conditions.
This last example highlights an important point: an experiment can have several levels of one independent variable. Here, temperature might be tested at , , and . Temperature is still just one independent variable because it is the single factor intentionally varied.
Key takeaways
A well-designed experiment is a fair comparison:
- The independent variable is what the scientist deliberately changes.
- The dependent variable is the measurable outcome.
- The control group supplies a baseline for comparison.
- Constants are relevant conditions kept the same across groups.
- If groups differ in more than the intended independent variable, confounding variables can make the result unclear.
In the bean experiment, water condition is the independent variable, germination rate is the dependent variable, the unwatered pot is the control group, and features such as seed number, pot type, and growing conditions are constants.
Next, you will build on this skill by interpreting biological data graphs and separating a correlation—two variables changing together—from strong evidence that one factor caused the other.
Can't find a good explanation? Sign up and we'll make it for you
Sign up