
Hello! Welcome to the first lesson in our module on Data Storytelling and Stakeholder Influence.
In our last lesson, you drafted a data-driven marketing plan, translating insights from MMM and incrementality tests into a strategic budget and forecast. That was the "what"—the analytical foundation. Now, we shift to the "how"—how you present that plan to get buy-in, secure resources, and inspire action. A brilliant strategy is only effective if you can persuade others to believe in it.
Your learning outcome for this lesson is to structure a compelling narrative that connects analytical findings to specific business outcomes. This skill is central to your transition into a strategic leadership role, as it's the bridge between data and decisions.
1. From Data Points to Narrative Arc
At its core, storytelling with data isn't about decorating charts; it's about providing a clear, logical, and persuasive path from an observation to a conclusion. The most fundamental structure for any story, whether in a novel or a boardroom, is a three-act play: Setup, Conflict, and Resolution.
Let's watch a short video from Harvard Business Review that introduces this simple but powerful concept.
Telling Stories with Data in 3 Steps (Quick Study)
The video 'Telling Stories with Data in 3 Steps' introduces the universal storytelling framework of Setup, Conflict, and Resolution. It demonstrates how to find these elements within a data chart.
Please watch this 4-minute video. Pay close attention to how the presenter deconstructs a complex chart to find a story and then reconstructs the visuals to tell that story clearly.
This framework translates directly to a business context:
- Setup: The current state of the business; the established context.
- Example: "In Q3, our overall marketing ROI was 4.5x, and we generated 1,200 new customers."
- Conflict: The challenge, opportunity, or unexpected change that the data reveals. This is the "Aha!" moment.
- Example: "However, our channel-level analysis reveals that our Meta Ads campaigns, which account for 40% of our budget, have a marginal ROI of just 0.8x, meaning we are losing money on every incremental dollar spent there."
- Resolution: The proposed action and the new, better reality it will create.
- Example: "Therefore, by reallocating $100k from Meta Ads to our Google Search campaigns (which have a marginal ROI of 3.2x), we can increase total incremental revenue by $240k without increasing our overall budget."
This simple structure transforms a dry data point ("Meta mROI is 0.8x") into a compelling argument for change.
2. The SCR Framework: A Consultant's Approach to Storytelling
Top consulting firms like McKinsey have refined this structure into a powerful tool for executive communication called SCR: Situation, Complication, Resolution. It’s designed to be logical, persuasive, and efficient for a leadership audience.
- Situation: A non-controversial statement of the current context that everyone in the room agrees on.
- Complication: The change or problem that disrupts the situation. This is where you introduce the tension.
- Resolution: Your proposed solution to the complication. This is your core recommendation.
The following video provides an excellent deep dive into the SCR framework and, crucially, offers a practical workflow for building your narrative before you even think about designing slides.
Storytelling in PowerPoint: Learn McKinsey’s 3-Step Framework
The video 'Storytelling in PowerPoint: Learn McKinsey’s 3-Step Framework' explains the SCR model and a practical method for applying it. This is a core skill for creating executive-level presentations.
Watch from 01:41 to 10:29. Focus on these key ideas: The definition of Situation, Complication, and Resolution (01:41). The 'dot-dash' method for storylining in a text document (05:04). The concepts of 'horizontal flow' (the story told by slide titles) and 'vertical flow' (the data supporting each title) (08:27).
The most valuable takeaway here is the process. As a leader, your time is precious. Storylining using the dot-dash structure in a document forces you to clarify your logic and get feedback on your argument before investing hours in PowerPoint.
- Dots (.) become your slide headlines (the horizontal flow).
- Dashes (-) become the charts and data points in the body of the slide (the vertical flow).
3. Tailoring the Story to the Audience
A powerful narrative is not one-size-fits-all. A story that resonates with your campaign managers will fall flat with your CFO. As a leader, you must translate the same core insight into different narratives for different audiences.
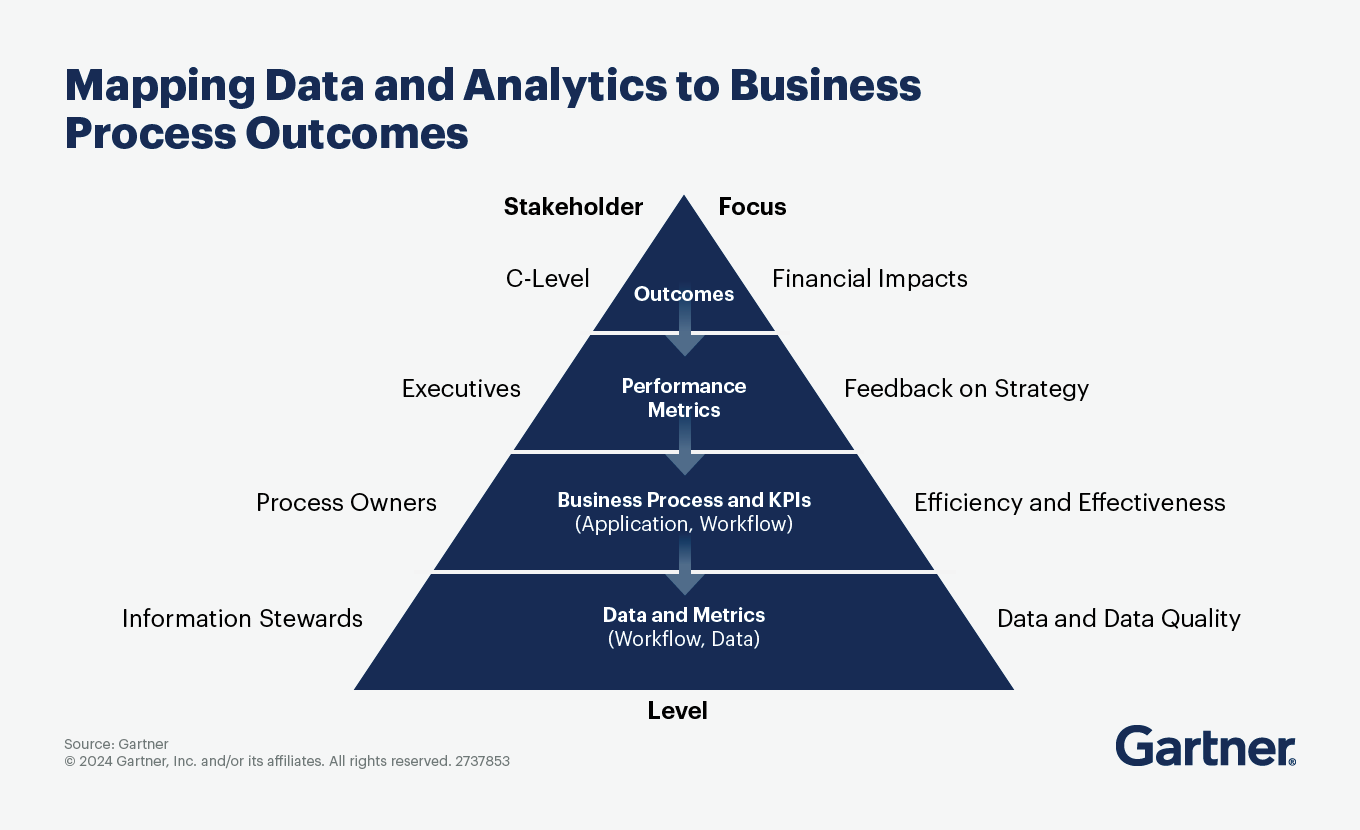
The image below shows a useful hierarchy. When you present to the C-suite, you must speak the language of the top of the pyramid: financial impact and strategic outcomes. When you speak to your team, you can operate further down: KPIs, efficiency, and process.
Let's read a short article that provides excellent guidance on tailoring your presentation.
Marketing data presentation that inspires action
The article 'Marketing data presentation that inspires action' from Funnel.io offers practical advice on connecting your data to what your audience cares about most.
Please read section 1 ('Understand your audience’s needs'), section 2 ('Use emotion to craft a compelling narrative'), and the example in section 3 ('An effective data presentation example'). Focus on how to frame a challenging result (like a drop in ROI) in a strategic context for a C-suite audience.
The key is to reframe the same finding based on the listener's perspective. Consider this analytical finding: "Our latest incrementality study shows our affiliate marketing channel has near-zero incremental lift."
- Narrative for the CFO: "We've identified a $250,000 cost-saving opportunity within our marketing budget. Our data shows the affiliate channel isn't causally driving sales, allowing us to reallocate this budget to fund higher-impact initiatives like top-of-funnel brand investment, which our MMM shows is a key driver of long-term growth." (Focus: Financials, ROI, strategic reallocation).
- Narrative for the Affiliate Marketing Manager: "The latest incrementality results give us a critical insight into how the affiliate channel is functioning. It seems to be capturing last-click credit for sales that would have happened anyway. This presents an opportunity for us to evolve the program's strategy. Let's work together to pivot our affiliate partners towards new customer acquisition or content partnerships, and we'll adjust our measurement to focus on metrics like 'percent of new-to-file customers' instead of just revenue." (Focus: Strategic evolution, new goals, collaboration).
Test your understanding!
You have an analytical finding: "Our MMM shows that SEO has a very high marginal ROI and is not yet saturated, while Paid Search is nearing saturation with a low marginal ROI." How would you frame a narrative recommending a budget shift for your CEO versus your Head of SEM (who manages both SEO and Paid Search)?
Show answer
-
Narrative for the CEO: "I have a proposal to accelerate our revenue growth while improving marketing efficiency. Our models show that for every additional dollar we invest in SEO, we get over $5 back in incremental revenue. By reallocating 20% of our Paid Search budget—a channel that's reaching diminishing returns—into SEO content and technical improvements, we can increase our net marketing-generated profit by an estimated $400k next quarter." (Focus: Growth, efficiency, profit, high-level numbers).
-
Narrative for the Head of SEM: "The latest MMM results give us a clear path to optimize our search portfolio. It confirms our SEO efforts are working incredibly well and have a lot of room to grow. The model suggests Paid Search is hitting its ceiling at the current spend level. I'd like you to develop a plan to shift about 20% of the paid search budget to scale up our most successful SEO initiatives. Let's think about how we can use the paid search data to inform our SEO content strategy, so the channels work even more effectively together." (Focus: Portfolio optimization, scaling success, inter-channel strategy, collaboration).
4. A Menu of Storytelling Frameworks
While SCR is a powerful all-purpose framework, other structures can be more effective in specific situations. Here are two more to add to your toolkit, adapted for data presentations.
Storytelling Frameworks for Data Analysts | Medium
The article '6 Storytelling Frameworks Every Analyst Should Know' provides several useful models. We will focus on two of the most practical ones for a marketing leader.
Please read the sections on 'AIDA — The Classic Persuader' and 'What?, So What?, Now What?'. Note how each framework is structured to drive a specific type of conversation.
What? -> So What? -> Now What?
This is perhaps the most direct and useful framework for day-to-day communication and reporting. It ensures you never present a finding without its implication and a proposed action.
- What? The objective fact or finding.
- Example: "Our LTV/CAC ratio dropped from 3.5 to 2.8 last quarter."
- So What? The business impact or implication of the finding.
- Example: "This means the profitability of our customer acquisition has declined, putting our growth targets at risk if the trend continues."
- Now What? The recommended next step or decision.
- Example: "We need to analyze the LTV of recent cohorts to see if the issue is lower value customers or rising acquisition costs, and then launch an experiment to address the specific driver."
This framework is your best defense against a stakeholder ever asking, "...and? Why are you telling me this?"

Conclusion
Structuring your communication as a story is not about being theatrical; it's about being clear, persuasive, and effective. As a leader, your role is to guide the organization from data to insight and from insight to action. A well-structured narrative is your primary tool for doing so.
Key Takeaways:
- Every data story needs a structure: Simple frameworks like Setup -> Conflict -> Resolution or Situation -> Complication -> Resolution (SCR) provide a logical and persuasive foundation.
- Always connect the dots: Use the What? -> So What? -> Now What? framework to ensure every analytical finding is tied to a business implication and a clear recommendation.
- Know your audience: Tailor your narrative to what your stakeholders care about most—financials for the C-suite, strategy and tactics for your team.
- Plan your story first: Use methods like the dot-dash structure to build your argument in a document before you create a single slide.
Preview of the Next Lesson:
You now have the frameworks to structure a compelling narrative. In our next lesson, we will build on this by focusing on tailoring data presentations to different audiences (e.g., C-suite, finance, product teams). We will go deeper into the specific language, metrics, and visuals that resonate most effectively with each key stakeholder group.