
Hello! Welcome to the final lesson in our module on "Data Storytelling and Stakeholder Influence."
In our last session, you learned how to create a high-level communication plan to manage a significant, data-driven change in strategy. We focused on identifying your audience, defining objectives, and planning the "who, what, and when" of your communication.
Today, we zoom in to execute the most critical piece of that plan: the high-stakes presentation. Your learning outcome is to present a complex analytical finding (e.g., from an incrementality test) in a simple, persuasive manner. This is where your analytical work meets leadership. Mastering this skill will enable you to walk into a room with executives, articulate the business value of your findings, and drive strategic decisions.
Let's get started.
The Challenge: From Complex Data to Clear Story
As a marketing leader, you will be presented with complex analyses from your team—A/B tests, media mix models, or, as we'll focus on today, incrementality tests. The raw output is often a dense collection of statistics, tables, and technical jargon. Your job is not to regurgitate that data but to translate it into a compelling story that answers the most important question on any executive's mind: "So what?"
This process of translation is called data storytelling.
Data Storytelling: How to Tell a Story with Data
To understand the core components of this skill, let's start with a foundational article from Harvard Business School Online.
Please read the sections 'What Is Data Storytelling?' and 'The Psychological Power of Storytelling.' This will explain the three key ingredients—data, narrative, and visuals—and why structuring information as a story makes it so memorable and persuasive.
As the article highlights, a good data story combines solid data with a clear narrative and supportive visuals. The narrative is the glue that holds everything together and makes the data meaningful.
The SCR Framework: A Blueprint for Persuasion
So, how do you build a powerful narrative? One of the most effective frameworks, used by top consulting firms like McKinsey, is SCR: Situation, Complication, Resolution. It’s a simple, logical structure that guides your audience from a shared understanding to your recommended course of action.
Storytelling in PowerPoint: Learn McKinsey’s 3-Step Framework
This video provides an excellent breakdown of the SCR framework and how it's used to build influential presentations.
Please watch from the beginning to 05:04. This will introduce you to the SCR (sometimes called SCQA) framework, explain each component, and show a real-world example of how McKinsey used it to structure a compelling argument.
Let's solidify those concepts. The SCR framework breaks down as follows:
- S - Situation: This is the non-controversial context. It's the current state of the business that everyone in the room can agree on. You might start with, "We currently invest $X across our marketing channels..." or "Our primary goal this quarter is to improve profitability..." This establishes a common ground.
- C - Complication: This is the core of your story. It's the insight, the problem, or the opportunity that disrupts the situation. This is where you introduce your key analytical finding. For example, "However, our latest analysis shows that Channel X, despite high platform-reported ROAS, has near-zero incremental impact..." This creates tension and grabs the audience's attention.
- R - Resolution: This is your "so what." It's your clear, actionable recommendation that solves the complication. "Therefore, we recommend reallocating 50% of the budget from Channel X to Channel Y, which we've proven drives a 15% incremental lift in sales." This provides the path forward.
This structure turns a data dump into a decision-making tool.
Applying SCR to an Incrementality Test
Now, let's make this practical. We'll use a real-world case study of an incrementality test and build an SCR narrative to present its findings to a CFO.
First, you need to be confident in the analysis itself. Let's review the mechanics of an incrementality test and what its findings look like.
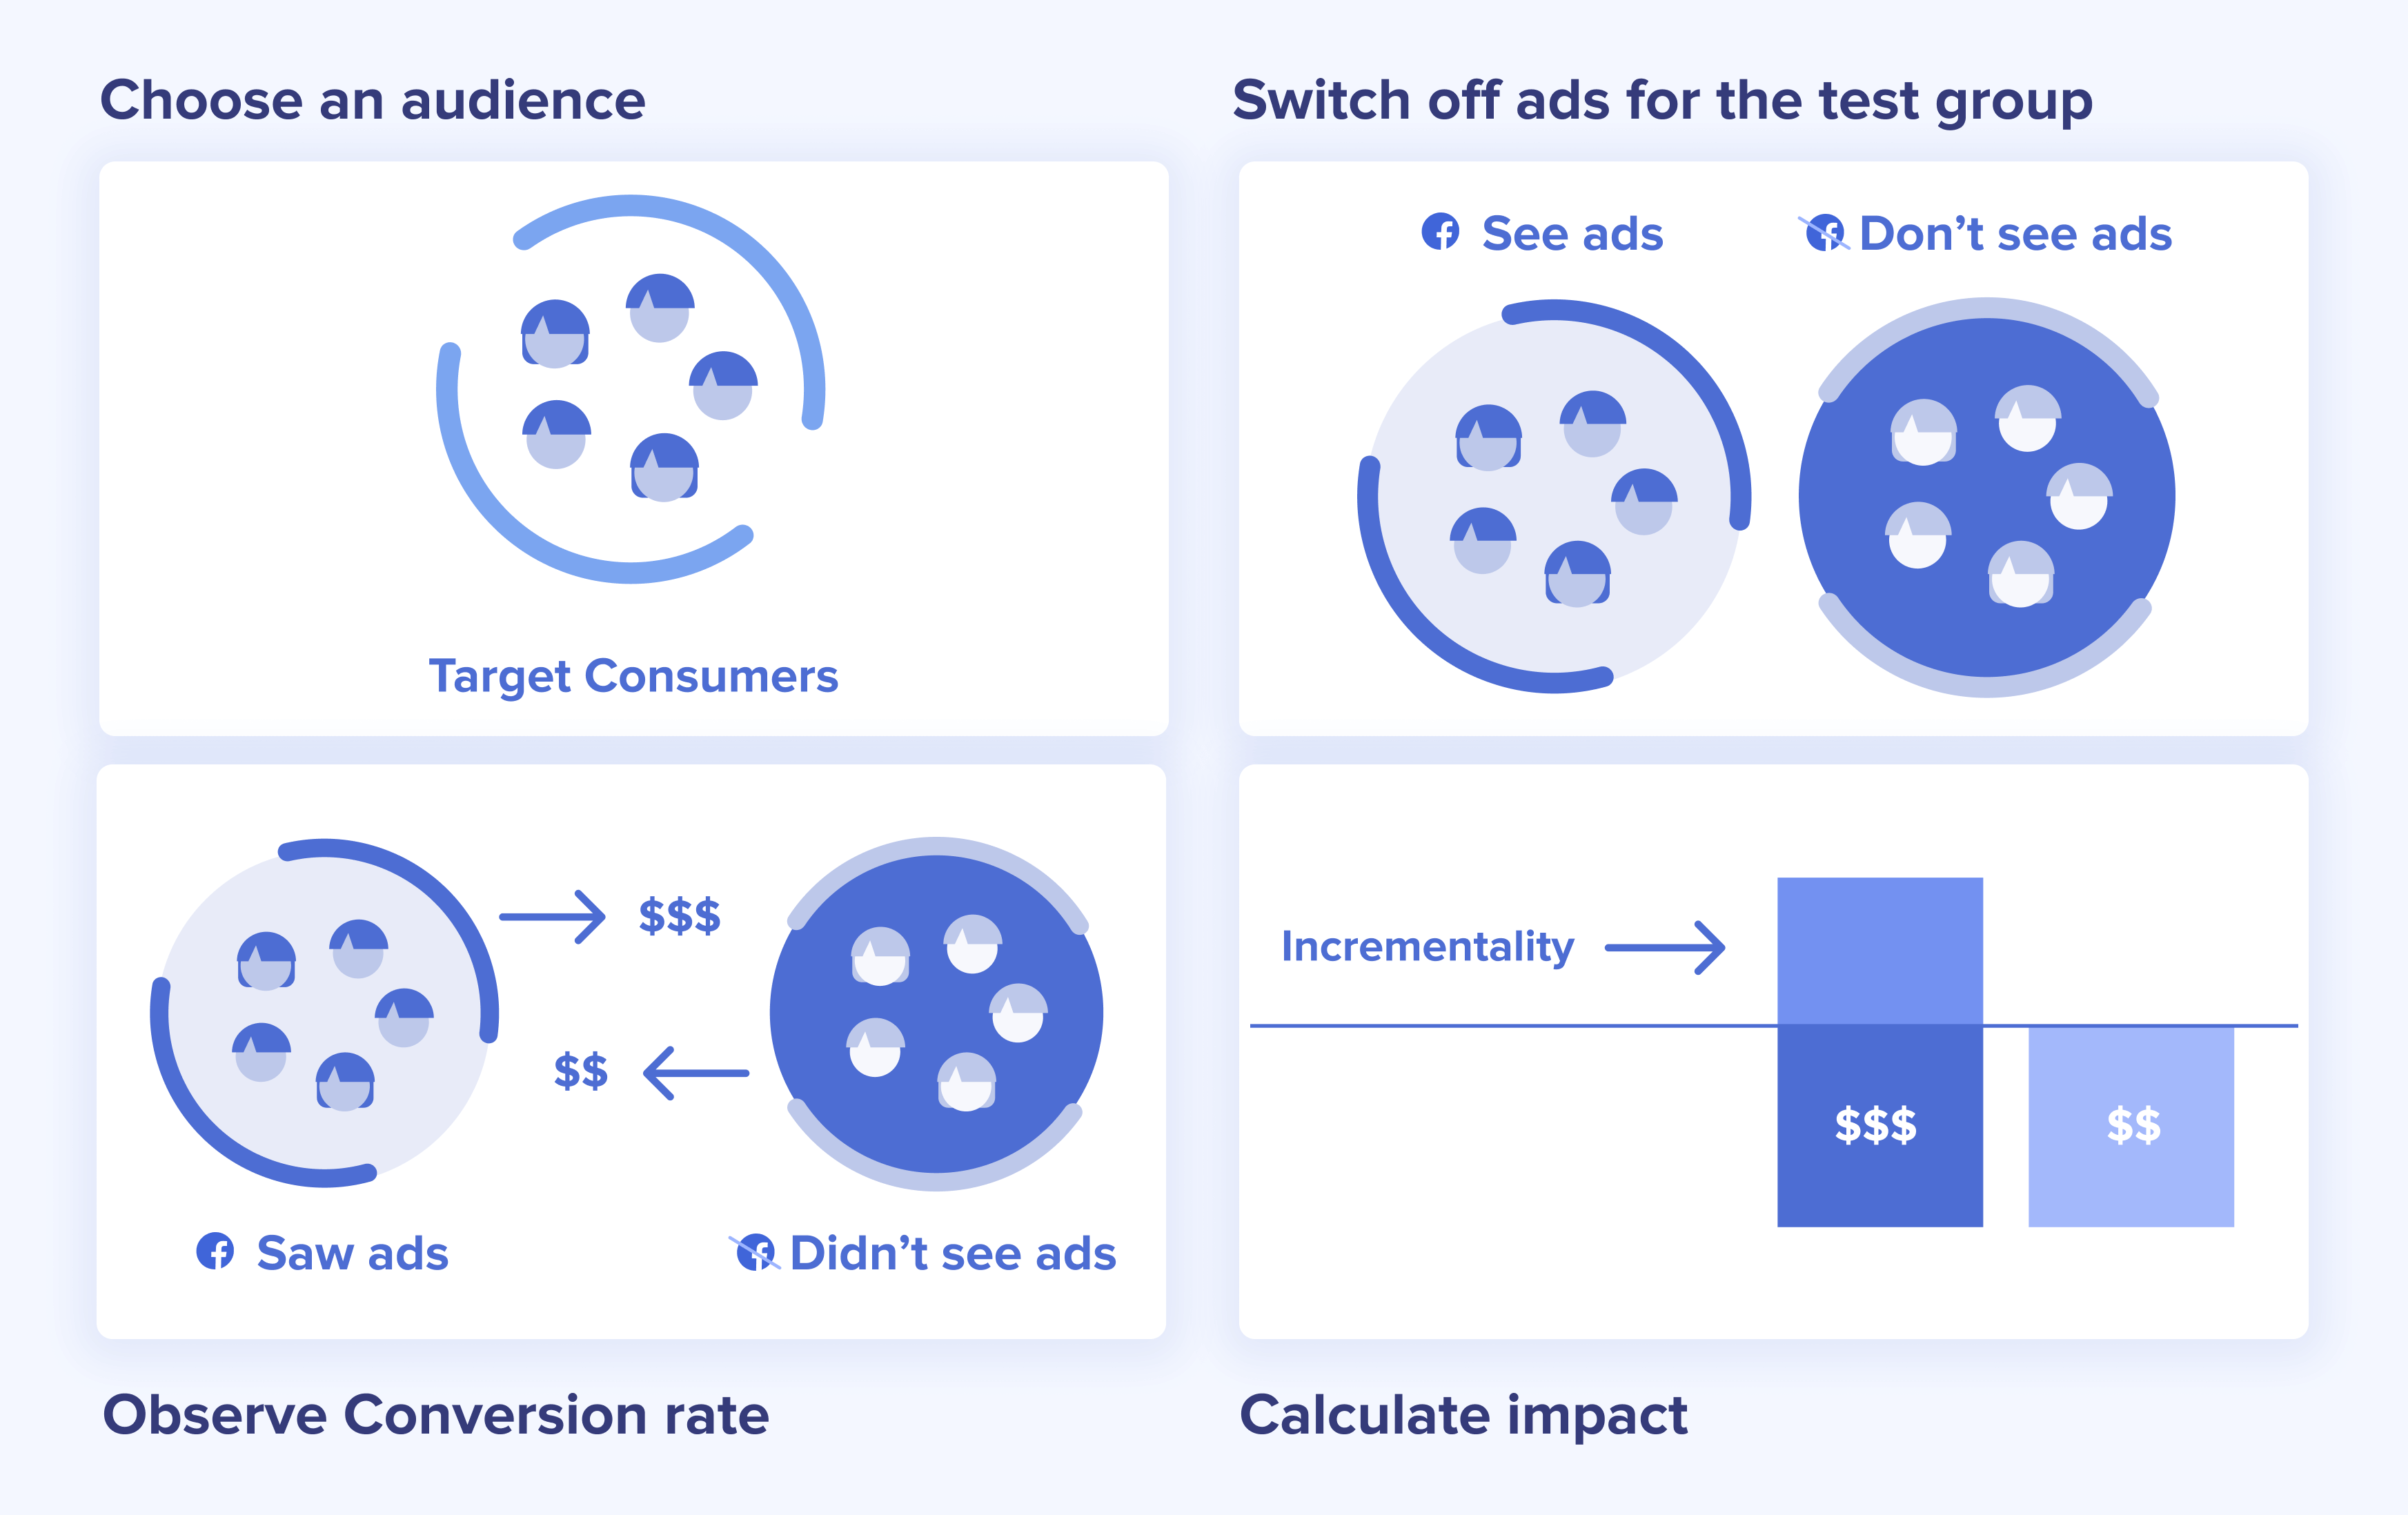
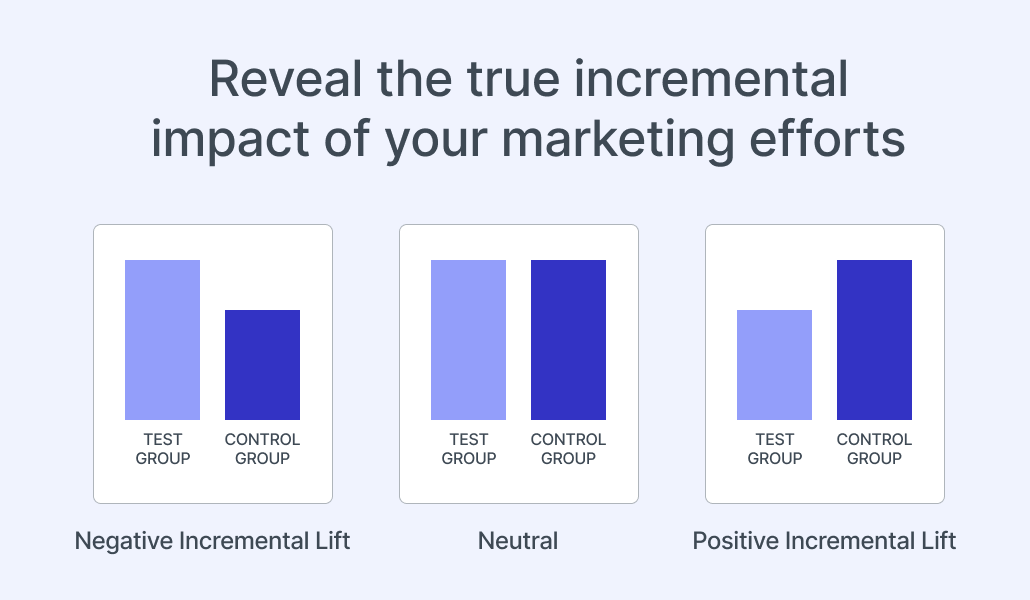
Now, let's dive into the data we need to present.
How to Test Marketing Incrementality (Real Case Study)
This article from Five Nine Strategy includes a perfect real-world case study. We will use its findings as the 'complex analysis' we need to present.
Please read the section titled 'Case Study: Google Ads vs. Meta Ads Incrementality Test.' Focus on the 'Test Methodology,' 'Analysis and Findings' (especially the summary table), and 'Key Findings.' Don't worry about memorizing every detail; just get a clear sense of what was tested and what the main result was.
You've read the case study. The data is complex: two test markets, a control market, different time periods, and multiple metrics. A CFO doesn't have time for all that. Your job is to extract the single most important insight and frame it using SCR.
Here's how you could structure your presentation:
1. The Situation
(One slide, maybe two. Title: "Our Current Strategy Relies on Google & Meta for National Growth")
"Good morning. As you know, our national marketing strategy relies heavily on Google and Meta ads to drive sales. Both platforms report strong performance based on their attribution models, and we currently allocate significant budget to each."
- Your goal here is to state the current reality that everyone agrees with. You're not introducing anything new or controversial.
2. The Complication
(The most important part of your presentation. Title: "However, a recent test reveals Meta provides significantly more true sales lift.")
"To understand the true, causal impact of these channels, we conducted a matched-market incrementality test over three months. We isolated the effects of running Google Ads alone versus running Google and Meta Ads together.
The results were striking. In markets with Google Ads only, we saw a 2.2% incremental lift in sales compared to doing nothing.
However, in markets where we ran Google Ads + Meta Ads, we saw a 13% incremental lift in sales.
This means that while Google Ads contribute, the combination with Meta is nearly 6 times more effective at driving new sales that wouldn't have happened otherwise."
- Here, you introduce the conflict. You've uncovered a powerful insight that challenges the current strategy. Notice how we've simplified the complex table from the article into one clear, comparative takeaway.
3. The Resolution
(The final, decisive part. Title: "Recommendation: Scale our combined Google + Meta strategy to maximize incremental ROAS")
"Therefore, to maximize the true ROI of our marketing spend, we recommend reallocating a portion of our budget to ensure we are running a strong, combined Google and Meta strategy in all our key markets, rather than relying on Google alone in some areas.
Our forecast shows that a $500k shift in budget could generate an additional $1.2M in incremental sales over the next six months. Our next steps are to build a detailed rollout plan for this budget reallocation for your approval."
- This is your clear, confident recommendation. It directly addresses the complication, is supported by the data, and includes a bottom-line business impact (the forecasted sales) and a clear next step.
Test your understanding!
In the "Complication" section above, we simplified the results table from the LINK article. The original table also included "Conversion Growth" and "Conversion Lift." Why was it a good strategic choice to omit those details in a presentation for a CFO?
Show answer
It was a good choice because a C-suite audience, especially a CFO, is primarily concerned with the ultimate business outcome: sales and revenue.
While "conversions" are an important intermediate metric for the marketing team, they can be ambiguous (e.g., a lead, a signup, a download). Presenting the "Sales Lift" is more direct and speaks the language of business impact. Including too many metrics clutters the core message and can lead to questions about the relationship between conversions and sales, distracting from the main point. The goal is maximum clarity and impact, not maximum detail.
Bringing it to Life: Visuals and Delivery
Your narrative is the skeleton, but you need visuals and confident delivery to flesh it out.
- Simple Visuals: For the complication, don't show the full table from the article. Create a single, simple bar chart with two bars: "Google Only Sales Lift: 2.2%" and "Google + Meta Sales Lift: 13%". The visual contrast instantly tells the story.
- The "Dot-Dash" Method: When preparing your presentation, use the "dot-dash" method mentioned in the "Storytelling in PowerPoint" video. Write your main storyline points (the slide titles or "action titles") as bullet points (dots). Under each, list the supporting data points or charts (dashes). This ensures your logic is sound before you even open PowerPoint.
Storytelling in PowerPoint: Learn McKinsey’s 3-Step Framework
Let's revisit the video on McKinsey's framework to see how this preparation method works in practice.
Please watch from 05:04 to 10:18. This section explains the 'dot-dash' structure for outlining your story in Word first, and then how that translates into 'action titles' and slide bodies in PowerPoint. This is a highly effective workflow.
Conclusion
Presenting complex findings isn't about showing how much you know; it's about making your audience understand what they need to do. By translating dense analytics into a simple, persuasive SCR narrative, you elevate your role from a marketing practitioner to a strategic business leader.
Key Takeaways:
- Data storytelling combines data, narrative, and visuals to drive action.
- The Situation-Complication-Resolution (SCR) framework is a powerful blueprint for structuring a persuasive argument.
- Start with the agreed-upon context (Situation), introduce your key insight as a disruption (Complication), and provide a clear recommendation (Resolution).
- Simplify relentlessly. Focus on the one key takeaway for your audience and build your story around it.
- Use simple, powerful visuals that reinforce your narrative, rather than cluttering it.
Preview of Your Next Module:
Congratulations on completing the "Data Storytelling and Stakeholder Influence" module! You've learned how to anticipate questions, build communication plans, and now, how to present your case persuasively.
But even the most compelling, data-backed story can face organizational headwinds. In our next lesson, we will kick off the final module of the course, "Building a High-Performance Marketing Organization." Our first topic will be "Identify common sources of organizational resistance to data-driven marketing and develop mitigation strategies." This will equip you to navigate the human and structural challenges of fostering a truly data-driven culture.