
Welcome back. In the previous lesson, you made the IEEE 9-bus case numerically consistent: network quantities were placed on the correct bases, line charging was treated as total , explicit GSU impedances were not duplicated in machine data, and generation and load signs were checked.
Now you will use the AC power-flow solution as a structured engineering test of that model. The objective is not merely to obtain a “solved” message. You will learn to distinguish numerical convergence from a credible operating point, identify the bus or component behind a mismatch, recognize voltage-control and reactive-limit behavior, verify topology, and understand why interchange checks matter in large utility cases even though the 9-bus benchmark is a single-area system.
By the end, you should have a solved, documented IEEE 9-bus .sav file and a short solution-validation record that can serve as the base case for the next contingency lesson.
What a power-flow solution is actually solving
An AC power flow finds bus-voltage magnitudes and phase angles that satisfy real- and reactive-power balance throughout the network. At each bus, the specified net injection must match the injection calculated from the network admittance matrix and bus voltages.
A useful expression for the real-power residual at bus is:
and similarly for reactive power:
The solver iteratively changes voltage magnitudes and angles to reduce these residuals. The largest mismatch is simply the largest remaining residual among the equations being solved. It is a numerical indicator, not an engineering conclusion by itself.
Three bus roles organize the problem:
| Bus role | Quantities held at their specified values | Quantities found by the solution | IEEE 9-bus use |
|---|---|---|---|
| Swing bus | Voltage magnitude and angle | Real and reactive generation needed for balance | Bus 1 |
| PV bus | Real generation and voltage magnitude | Reactive generation and voltage angle | Buses 2 and 3 |
| PQ bus | Real and reactive demand, or net injection | Voltage magnitude and angle | Load and transmission buses |
The swing generator is not intended to represent an infinitely flexible physical unit. It is the mathematical balance point. Its MW output changes to cover the difference between scheduled generation, load, and network losses.
For the teaching case, total specified load is:
The two non-swing generators are scheduled at:
Therefore, even before solving, you know that Generator 1 must provide approximately 67 MW plus real-power losses. If the solved swing output is close to 72 MW, that is plausible. If it becomes 180 MW or negative 50 MW, do not accept the case merely because it converged.
The real-power accounting check is:
Reactive power does not admit such a simple visual check because generators, loads, transformer leakage reactance, shunts, and line charging all contribute. Still, an unexpectedly large reactive output or absorption is often the first clue that a voltage-control setting, line-charging value, or impedance is wrong.
Voltage control, reactive limits, and the machine record
At a PV bus, PSS®E attempts to hold a specified voltage by changing the generator’s reactive output. This is why a generator’s scheduled voltage and reactive limits matter as much as its MW dispatch.
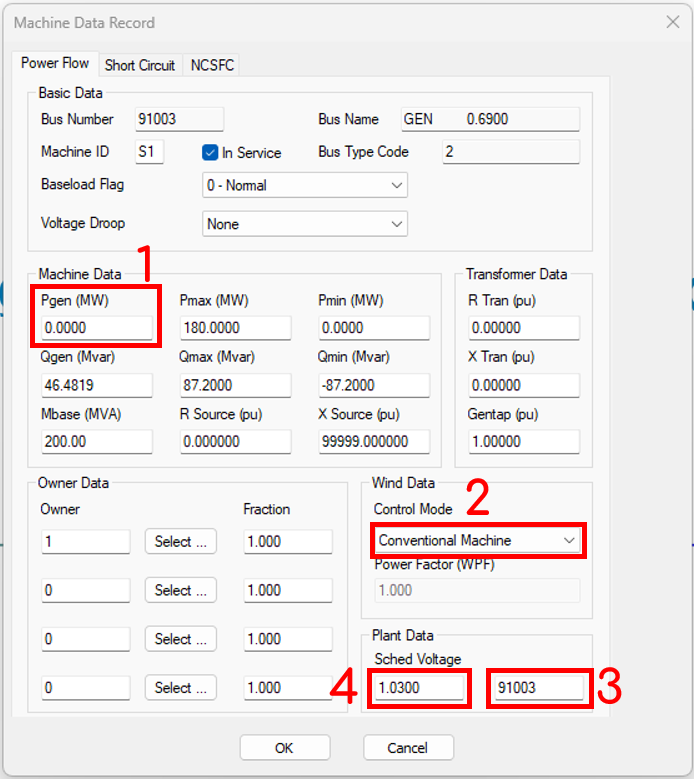
The displayed dialog contains four concepts to verify in your 9-bus machine records:
-
Pgen is the scheduled real-power generation for a non-swing machine. It is fixed during the ordinary power-flow solution unless a balancing or control mode explicitly changes it.
-
Control mode should be appropriate to the modeled resource. For this synchronous-generator benchmark, conventional machine control is appropriate. Later, renewable and BESS models will require more deliberate treatment of plant-level and inverter-level controls.
-
Regulated bus identifies where the generator measures or controls voltage. In the simple 9-bus case, each generator should regulate its own terminal bus unless your published reference data specifically states otherwise.
-
Scheduled voltage is the voltage target in per unit. It is not a guarantee. The generator can meet it only while its reactive output remains between and .
When a generator reaches a reactive limit, it can no longer behave as a PV bus. The solution treats it effectively as a PQ bus at the limiting reactive output, and the controlled-bus voltage is allowed to move away from the scheduled value. This is often physically correct. It is nevertheless a warning flag in a benchmark case if you did not expect the limit to bind.
For your IEEE 9-bus case, confirm the following before solving:
| Item | Expected setting |
|---|---|
| Bus 1 | Swing bus, voltage near 1.04 p.u. |
| Bus 2 | PV bus, MW, voltage target near 1.025 p.u. |
| Bus 3 | PV bus, MW, voltage target near 1.025 p.u. |
| Generator Mvar limits | Wide enough that the benchmark’s normal solution does not unintentionally force a PV-to-PQ conversion |
| Regulated bus | The generator’s own bus for this benchmark |
| All machines | In service, with the intended machine IDs |
Do not “fix” a voltage deviation by expanding or until you know why the limit was reached. In a utility case, that could conceal an incorrect transformer tap, a missing capacitor bank, an erroneous line-charging value, or an incorrect plant reactive-capability representation.
Execute a controlled first solution
For this first solve, use the full Newton-Raphson solution method, commonly identified in PSS®E as FNSL. It is a sound default for validating a newly built case because it uses the full Jacobian and is generally more informative for a case that may contain modeling defects. Fixed-slope decoupled methods are useful for high-volume, well-conditioned contingency workflows, but this is not yet that stage.
Before solving, create a new saved revision, for example:
IEEE9_PREFLOW_R00.sav
Then set PSS®E to retain a diagnostic record of the solution. In the GUI, use Input/Output Control and the Direct Progress Output option, often called PDEV, to send progress output to a text file. Use a file name that identifies the case revision, such as:
IEEE9_BASE_SOLVE_progress.txt
PSS/E Automation: Python, CLI & PDEV Guide
Read the Direct Progress Output discussion from Keentel Engineering to understand why solver output is worth retaining, even for a small case.
In the subsection “Capturing Solver Behaviour with Direct Progress Output (PDEV),” read the progress-output explanation. Focus on the distinction between a one-line solved status and the more useful diagnostic history: iterations, largest mismatches, tap actions, shunt actions, and warnings.
Now run the full Newton solution. Record the following directly after the solve:
- whether PSS®E reports a successful solution;
- the final largest mismatch and its bus;
- the number of iterations;
- whether any generator reached a reactive limit;
- whether any transformer taps or shunts moved;
- whether there are islanding, convergence, or area-interchange messages.
For a correctly entered IEEE 9-bus case, the solution should converge readily. A convergence message alone, however, is only the start of the review.
A disciplined order for reviewing results
Review outputs in this order:
-
Numerical status. Did the solution converge within your selected mismatch tolerance?
-
Network connectivity. Are all intended buses energized and connected to the main island?
-
Real-power balance. Is the swing-generator MW output consistent with the system load plus credible losses?
-
Voltage and reactive-power behavior. Are voltages reasonable, and did a generator reach a reactive limit unexpectedly?
-
Branch flow and rating results. Are flows directionally plausible, and are ratings populated before interpreting loading percentages?
-
Area and interchange results. Does actual interchange agree with scheduled interchange where multiple model areas are used?
This order matters. A thermal percentage is not meaningful if the case contains an island, a generator has been unintentionally switched out of service, or the swing machine is compensating for a large modeling mistake.
Read the solved case as an engineering report
The SPP Model Development Procedure Manual’s steady-state review guidance scales directly from this benchmark to actual regional planning models: examine selected voltages, major flows, overloaded elements, and generator outputs rather than relying on a solved flag.
spp%20model%20development%20procedure%20manual%202022%20v7.0.docx
Read SPP’s guidance on reviewing a solved steady-state model. It gives a practical framework for distinguishing unusual results that require investigation from ordinary power-flow variation.
Find the “Review of Output” discussion in the Network section. Read the three-report review, covering the voltage summary, overloaded-branch summary, and generation summary. Focus especially on the stated links among voltage problems, shunts, tap settings, impedances, ratings, generator Mvar limits, and regulated-bus voltage targets.
1. Check the voltage profile
For the conventional 9-bus data set used in this course, a typical reference solution is approximately:
| Bus | Expected voltage magnitude, p.u. | Expected angle, degrees |
|---|---|---|
| 1 | 1.040 | 0.000 |
| 2 | 1.025 | 9.280 |
| 3 | 1.025 | 4.665 |
| 4 | 1.026 | -2.217 |
| 5 | 0.996 | -3.989 |
| 6 | 1.013 | -3.687 |
| 7 | 1.026 | 3.719 |
| 8 | 1.016 | 0.728 |
| 9 | 1.032 | 1.967 |
Treat these as validation targets, not universal constants. Small differences can occur when source data, transformer representation, rounding, bus-voltage targets, or control settings differ. Large differences need explanation.
A useful comparison is:
An absolute difference of a few thousandths of a per unit may be rounding. A difference of several hundredths of a per unit at several buses usually indicates a substantive difference in impedance, transformer data, voltage setpoints, reactive limits, or shunt charging.
For this case, pay particular attention to:
- Buses 1, 2, and 3: Their voltage magnitudes should match their regulated voltage targets if no reactive limits bind.
- Bus 5: It is a major load bus and normally provides a useful check of the transmission-path and load representation.
- Buses 4, 7, and 9: These are the high-voltage sides of the GSUs; their voltages help reveal transformer-ratio or tap-entry errors.
- All bus angles: The absolute angle reference is arbitrary, but the angle differences and general power-transfer pattern should be credible.
2. Check the generation summary
With the stated loading and generator dispatch, a typical result is:
| Generator bus | Approximate MW | Approximate Mvar | Interpretation |
|---|---|---|---|
| 1, swing | 71.64 | 27.05 | Covers remaining demand and losses |
| 2, PV | 163.00 | 6.70 | Holds its voltage target through reactive adjustment |
| 3, PV | 85.00 | -10.90 | Absorbs reactive power while holding voltage |
The expected total real-power generation is approximately:
Thus, the expected real-power loss is approximately:
A negative Mvar value at Generator 3 is not necessarily a problem. It means that the machine is absorbing reactive power. Its voltage target can still be met because the reactive output remains inside its configured limits.
Instead, investigate if you see any of the following:
- A non-swing generator MW output changed from its scheduled value without an intended balancing mode.
- The swing generator changed by a large amount relative to the roughly 72 MW expectation.
- A generator is at or when the reference case indicates it should not be.
- A PV-bus voltage differs materially from its voltage target while the generator is not reported as limited.
- A generator is assigned to the wrong bus, has the wrong machine ID, or is out of service.
3. Check branch flows, but interpret ratings correctly
Inspect the major transmission paths and the three GSUs. First ask whether the direction and relative magnitude of MW flow make sense given that Buses 1, 2, and 3 generate while Buses 5, 6, and 8 consume.
Then check the loading report. The teaching case may have provisional or absent thermal ratings, so it is important to distinguish:
- Calculated flow: a valid electrical result, usually MW, Mvar, current, or MVA.
- Percent loading: meaningful only when the applicable normal or emergency MVA rating has been entered.
- An overload conclusion: valid only when the rating source, seasonal condition, and contingency category are known.
Do not claim that a branch is thermally adequate simply because PSS®E does not report it overloaded while its rating fields are blank or arbitrary.
Diagnose mismatches and non-convergence systematically
A new case can fail to solve because of one simple data defect, but changing several controls at once makes that defect harder to find. Preserve each diagnostic attempt as a separate .sav revision and retain its progress file.
The SPP manual lists realistic causes that recur in utility base-case work: missing or incorrectly connected ties, islands, extreme impedance or susceptance values, implausible tap limits, conflicting voltage regulation, poor shunt control, and very low-reactance branches. The same logic applies to the 9-bus case.
If PSS®E does not converge
Use the progress output to determine whether the mismatch is decreasing, oscillating, or growing. Then examine the cause categories below.
| Evidence | Likely issue | Focused checks |
|---|---|---|
| Voltage angles diverge rapidly; a bus has no electrically credible source path | Unintended island or disconnected component | Check in-service status of every GSU and transmission branch; confirm all buses are in the intended connected network |
| A single bus has a large persistent mismatch | Incorrect injection, bus type, or adjacent branch data | Verify load MW/Mvar, machine MW, machine status, regulated bus, and every element connected to that bus |
| Iterations oscillate while tap settings or shunts change repeatedly | Conflicting controls or unrealistic control ranges | Temporarily hold suspect taps or shunts fixed; verify voltage schedules and controlled buses |
| Extreme voltages, such as close to zero or far above normal | Base error, incorrect transformer ratio, missing path, or extreme shunt | Recheck per-unit base, transformer winding kV entries, tap data, line charging, and fixed-shunt sign |
| Solver flags nearly zero reactance or behaves poorly around a short connection | Unrealistically low-impedance branch | Check decimal placement and whether two series segments should have been combined |
| An expected generator does not regulate voltage | Machine off-line, wrong bus type, wrong regulated bus, or reactive limit reached | Inspect machine status, bus type, voltage target, , , and controlled-bus assignment |
Do not use a flat start as the first remedy. A flat start can be a useful diagnostic later, but a correctly built 9-bus benchmark should solve from ordinary initial values. If it does not, first identify the data or topology inconsistency.
If the case converges but looks wrong
This is more dangerous than non-convergence because an apparently clean solution can be accepted too quickly.
Use this set of questions:
Is the swing MW output credible?
For the stated 9-bus dispatch, it should be on the order of 72 MW. A large deviation points first to a missing generator, an incorrect load sign or magnitude, a branch status issue, or an erroneously high-loss impedance.
Are PV voltages being maintained as intended?
If Buses 2 or 3 are far from their setpoints, determine whether the machine has reached a reactive limit. If it has not, inspect the controlled-bus assignment and machine control configuration.
Did a reactive limit bind unexpectedly?
Check whether the Mvar limits were entered correctly. A mistakenly narrow limit can create an apparent voltage problem. Conversely, an unlimited generator might hide an issue that should be represented by physical plant capability.
Are branch flows physically plausible?
A direction reversal is not automatically wrong; meshed networks can distribute power in unintuitive ways. But a severe reversal relative to a known benchmark, especially combined with unusual angle differences, can indicate swapped line terminals, a transformer phase-shift error, an incorrect tap, a wrong GSU connection, or a sign error in a control setting.
Are all intended elements in service?
Inspect the branch, transformer, machine, and load status fields. A case may converge after unintentionally removing a load, GSU, or line. In a real interconnection case, this is a classic source of misleadingly favorable results.
Are the voltage levels correct on both sides of each GSU?
A transformer winding entered at the wrong nominal kV can make a solution converge while producing unreasonable voltage behavior and reactive flows. Compare generator-side and transmission-side bus base kV values against the intended one-line diagram.
Understand mismatch versus interchange
A power mismatch is a residual in the numerical load-flow equations. It concerns whether the network equations have been solved.
Interchange is different. It is the actual net real-power transfer across the boundary of a modeled area, compared with the scheduled transfer for that area. It concerns operating and transaction representation.
The IEEE 9-bus practice case is normally a single-area system with no scheduled inter-area transaction. Therefore:
- there should be no meaningful scheduled interchange to enforce;
- Generator 1 acting as the swing machine is normal;
- the final system-wide generation-load difference should appear as losses.
In regional SPP, ERCOT, or WECC cases, multiple areas and transactions are common. A case can converge numerically while still having an unacceptable interchange setup. Examples include a missing tie line, an incorrect area assignment, an inconsistent transaction schedule, or an area that cannot balance its dispatch and losses under the specified interchange target.
Do not correct an interchange problem by manually changing the system swing unit’s MW output. That may make numbers look balanced while leaving the underlying area schedule, transaction, or topology wrong.
For your 9-bus record, state explicitly:
Interchange check: single-area benchmark; no scheduled inter-area interchange.
System balance is carried by the designated swing generator at Bus 1.
This small note develops the correct habit for larger study cases, where interchange checks are mandatory rather than merely informative.
Save a defensible base-case record
Once the case converges and the output agrees materially with the expected benchmark behavior, save the solved case under a new revision, for example:
IEEE9_SOLVED_BASE_R01.sav
Add the following to your workspace manifest:
Case: IEEE9_SOLVED_BASE_R01.sav
Solution method: Full Newton-Raphson
Convergence: [largest mismatch and iteration count]
Swing machine: Bus 1, ID [machine ID]
Solved swing output: [MW and Mvar]
Total load: 315 MW, 115 Mvar
Calculated real-power loss: [MW]
Generator reactive limits reached: [none / list]
Topology check: all intended buses and branches in service; no unintended islands
Interchange check: single-area benchmark; no scheduled interchange
Reference comparison: [brief statement of material agreements or differences]
Progress log: IEEE9_BASE_SOLVE_progress.txt
If your result differs materially from the approximate reference, do not overwrite the discrepancy. Record it, identify the likely source, correct one item at a time, and preserve the prior case revision. That is the same traceable workflow needed when reproducing a utility or cluster-study base case.
Key takeaways
A solved AC power flow is both a numerical result and a model-quality test.
- The largest mismatch measures the residual left in the solved network equations; it is not the same as a thermal violation or an area-interchange error.
- The swing generator supplies the remaining real and reactive balance after scheduled generation, load, and losses are accounted for.
- PV buses hold MW and voltage until their reactive limits are reached. At a reactive limit, voltage can depart from its target.
- In the standard IEEE 9-bus case, total load is 315 MW and the swing unit should produce roughly 72 MW, giving system losses near 4.6 MW.
- Review voltage, generator, branch-flow, topology, and interchange outputs even after clean convergence.
- Use the progress log and one-change-at-a-time case revisions to diagnose non-convergence or unreasonable results.
- The 9-bus case has no scheduled inter-area interchange, but the distinction between mismatch and interchange is essential preparation for SPP, ERCOT, and WECC study cases.
Next, you will apply a selected line or transformer outage and interpret the resulting N-1 thermal and voltage changes against this validated base case.
Can't find a good explanation? Sign up and we'll make it for you
Sign up