
Hello. In the previous lesson, you separated price certainty from execution certainty when choosing market, limit, stop-market, and stop-limit orders. That distinction matters financially: a stop-market order may do its job of getting you out, but the fill can be worse than the stop price; a market entry may get you in, but not at the price shown when you clicked.
This lesson turns a chart-based result into a trading-account result. You will calculate an NQ trade’s gross P/L from actual fills, subtract the full round-turn cost, and measure the execution difference called slippage. The same framework applies to MNQ; only the dollar value per point changes.
Gross P/L is not net P/L
For the standard E-mini Nasdaq-100 futures contract, NQ:
- Minimum price increment: points, or one tick
- Dollar value per tick:
- Dollar value per point:
For the Micro E-mini Nasdaq-100, MNQ:
- One tick:
- One point:
Your chart measures a move in points. Your account receives or loses the dollar value of that move after actual fills, then pays transaction costs.
For a long position:
For a short position:
The word actual is essential. A chart annotation such as “long at ” is a plan or visual reference; your brokerage fill report is the record of what was executed.
Your final result is:
For a completed intraday trade, transaction costs usually consist of:
- Entry-side cost
- Exit-side cost
- Any adverse execution cost already reflected in your actual fills, commonly called slippage
Do not add slippage twice. If you calculate gross P/L from your actual entry and exit prices, slippage is already inside gross P/L. You measure it separately to understand why realized results differed from the plan.
What “commission” really includes
A quoted broker commission is not always the complete cost of placing a futures order. A platform may show several line items, including broker commission, exchange fees, clearing or routing charges, and regulatory fees. The amount and labels depend on the broker, contract, account arrangement, and fee schedule.
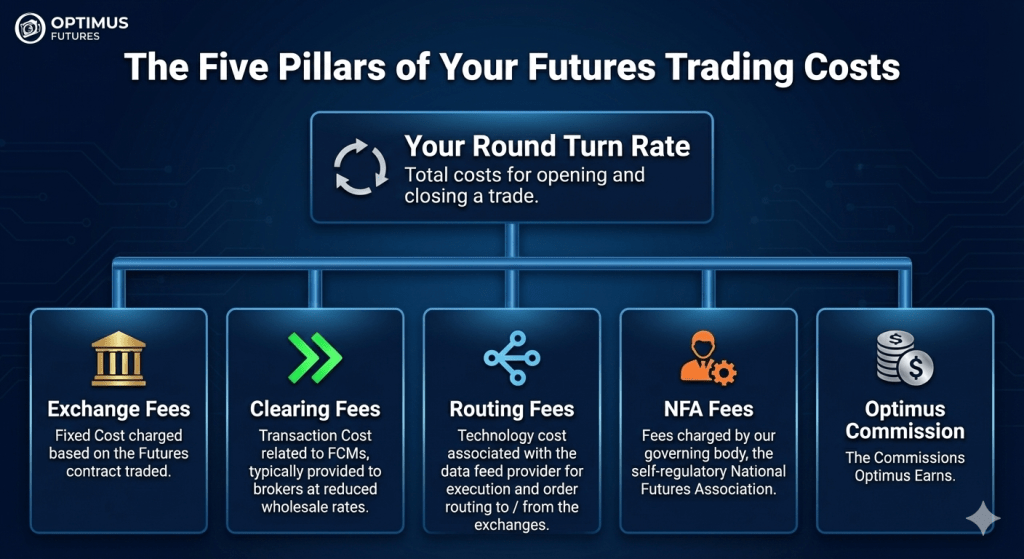
The useful number for planning is the all-in cost per contract per side. A side means one execution of one contract:
- Buying one NQ contract to open is one side.
- Selling that contract to close is a second side.
- Together they form one round turn or round trip.
If the all-in rate is per contract per side, then the completed-trade cost for contracts is:
For example, if an illustrative all-in NQ rate is per contract per side, trading two NQ contracts from entry to exit costs:
That cost applies whether the trade wins, loses, or exits flat.
Futures Commissions and Fees Explained
Watch “Futures Commissions and Fees Explained” from Key Level Trading to establish the language of per-side and round-turn costs. It also makes the practical point that transaction costs matter most when a strategy seeks relatively small moves.
Watch all in rates for the definition of a per-side charge and a round turn. Then watch per side costs for a concise numerical example. Finish with scalping impact, focusing on why a small gross edge can disappear after repeated costs. The particular fees in the video are broker- and contract-specific; retain the calculation framework, not its quoted rate.
Your own fee schedule is the authority. Interactive Brokers’ commission page, for example, separately shows its execution charge and notes that exchange and regulatory fees are passed through. It also lists MNQ among the e-micro products, but its displayed numbers should not be treated as a universal NQ or MNQ rate.
Read “Commissions Futures” from Interactive Brokers as an example of why a broker’s execution commission and the total trade cost can be different numbers.
In the United States section, locate the subsection “Spot-Quoted Futures, E-micro Futures and Futures Options,” which explicitly lists MNQ among the covered products. Read the MNQ schedule, including the note immediately below it about exchange and regulatory fees. Focus on the distinction between the broker execution fee and additional passed-through fees; do not assume these figures apply to a different broker or to standard NQ.
Monthly market-data subscriptions, platform rentals, and account fees also matter to your overall trading business. But they are not normally assigned to a single trade in the brokerage statement. Keep them separate from the per-trade net P/L calculation for now. Later, when assessing a strategy over many trades, you can decide how to incorporate fixed monthly costs.
Slippage: the difference between the benchmark and the fill
Slippage is the difference between your pre-defined reference price and the actual execution price. It is adverse when it makes the result worse.
It can occur on either side of a trade:
- A buy market order fills above the expected price.
- A sell market order fills below the expected price.
- A stop-market exit triggers at its stop price but fills at a worse available price.
- A target limit may receive price improvement, or it may simply not fill if price reverses before your order is reached in the queue.
For consistency, define the benchmark before submitting the order. Two common approaches are valid, but they answer slightly different questions:
| Benchmark | What it measures | Important implication |
|---|---|---|
| Planned trade price | Difference between the chart plan and the actual outcome | Includes the cost of crossing the spread if your plan used a midpoint, last price, or level on the chart |
| Best executable bid or ask at decision time | Execution shortfall beyond the immediately available quote | Does not treat the normal bid-ask spread as unexpected slippage |
For a developing day-trading journal, use the first approach initially: compare actual fills with your planned entry, stop, and target prices. It tells you whether the trade performed as planned from your setup’s perspective. Once you are routinely collecting bid/ask data and fill reports, you can separately study spread-crossing and execution quality.
For a long trade, adverse slippage in points is:
For a short trade, it is:
Then convert the result to dollars:
A favorable fill produces a negative value under these formulas. Record it rather than quietly rounding it away. Over a sufficiently large sample, you want the average realized execution effect, not just the worst cases you remember.
The mechanics are simple: a marketable order must find resting orders on the other side. If the available quantity at the expected price is insufficient, or price is moving rapidly, it can execute at progressively worse levels. NQ is generally liquid during the main New York session, but liquidity is not a guarantee of a particular fill—especially during abrupt volatility, thin periods, or scheduled market-moving releases.
Trading 101: What is "Trade Slippage"? (beginners beware!)
Watch “Trading 101: What is ‘Trade Slippage’?” from ClayTrader for a visual explanation of why the price you planned is not necessarily the price at which every unit executes. The example uses shares rather than futures, but the order-book matching logic applies to NQ.
Watch partial fills to see how a sell stop can meet limited buying interest at its intended price and complete at lower prices. Then watch planning slippage for the link between volatility, stop orders, and realized risk. Transfer the mechanism—not the share quantity or stock-specific numbers—to an NQ futures order.
Worked NQ example: a winner becomes a smaller winner
Assume this long trade plan:
| Item | Plan |
|---|---|
| Quantity | NQ contracts |
| Planned entry | |
| Target | |
| Planned move | points |
| Assumed all-in rate | per contract per side |
The planned gross profit is:
The two-contract round-turn transaction cost is:
So the planned result after known costs, but before slippage, is:
Now suppose the buy market entry actually fills at , two ticks above the planned entry. The sell limit target fills at .
The realized price move is no longer points:
Realized gross profit:
Realized net profit:
The entry slippage was points. Its dollar effect was:
Notice the reconciliation:
| Measure | Result |
|---|---|
| Planned gross P/L | |
| Less entry slippage | |
| Realized gross P/L | |
| Less all-in round-turn cost | |
| Realized net P/L |
The trade was still a winner. But the meaningful result for a journal, expectancy calculation, and risk review is , not the chart’s .
A stop-loss example: planned risk is not guaranteed risk
Now use the same two-contract NQ long, but with a protective sell stop-market at .
| Item | Plan |
|---|---|
| Entry | |
| Stop trigger | |
| Planned loss distance | points |
| Quantity | NQ contracts |
| Assumed all-in rate | per contract per side |
At the planned prices, gross loss would be:
Including the known round-turn cost, the planned net loss would be:
But a stop-market order uses as a trigger, not a guaranteed execution price. Suppose it fills at .
The realized gross loss is:
The stop slippage was:
Its dollar impact was:
The final realized net loss is:
The original technical stop distance was still logically correct. The difference is operational: the market gave a worse exit than the stop trigger. This is why a position-size calculation based only on the chart stop represents planned price risk, not a guaranteed maximum account loss.
For future trade planning, your dollar-risk cap should leave room for known transaction costs and a realistic slippage allowance. The allowance should come from recorded results in conditions similar to the setup, not from optimism or a single dramatic news-event loss.
A fill-report routine for every completed trade
When you complete an NQ or MNQ trade, record these items before reviewing the chart narrative:
- Contract and quantity: NQ or MNQ, and the number of contracts.
- Planned prices: intended entry, technical invalidation, and target.
- Actual average fills: entry and exit prices from the platform or brokerage report. Use volume-weighted average price if execution was partial.
- Gross P/L: calculated from actual fills.
- All-in round-turn cost: total commissions and fees for every contract and side.
- Net P/L: gross P/L less actual costs.
- Slippage: actual-fill difference from your pre-defined benchmark, stated in ticks, points, and dollars.
- Execution context: market, limit, stop-market, or stop-limit order; whether scheduled news or unusually fast conditions were present.
A compact journal entry might read:
Long NQ planned at , actual entry ; target filled . Gross , costs , net . Entry slippage: ticks, . Market-entry order.
This format separates a valid market read from an execution issue. A trade can be directionally correct but poorly executed; it can also be well executed yet lose because the auction premise failed. Treating both outcomes as merely “a win” or “a loss” prevents useful review.
Key takeaways
A chart move is only the starting point of trade accounting.
- Calculate gross P/L from actual average entry and exit fills, using per NQ point and per MNQ point.
- A completed trade incurs two sides per contract, so use the all-in round-turn cost, not an advertised commission alone.
- Slippage is the difference between a pre-defined benchmark and the actual fill. It may occur at entry, target, or stop.
- If gross P/L uses actual fills, do not subtract slippage again; measure it separately to explain the difference between planned and realized outcomes.
- A protective stop defines technical invalidation, but a stop-market fill can be worse than the trigger. Account for that possibility when setting practical risk limits.
Next, you will define a personal New York-session trading window and scheduled-news blackout periods—two operational boundaries that help reduce exposure to conditions where execution quality and decision-making can deteriorate.
Can't find a good explanation? Sign up and we'll make it for you
Sign up