
Hello. Last lesson focused on ratios and direct proportion: keeping quantities in a fixed relationship and finding the value of one equal part. The mean uses a similar idea of equal parts, but in a different setting: rather than sharing a mixture, we share a total amount of data equally across all the values.
In this lesson, you will calculate the mean of small data sets, interpret what the answer means, and check whether it is sensible. This is useful in science when summarising repeated measurements and in dentistry or health when comparing numerical records over several days or people.
The mean: an equal-share average
The mean is one type of average. It answers this question:
If the total were shared equally between every value, how much would each value have?
The calculation rule is:
In words:
- Add all the data values.
- Count how many values there are.
- Divide the total by that count.
The mean does not have to be one of the original values. It can be a decimal, because it represents an equal-share amount rather than necessarily an amount that was actually recorded.
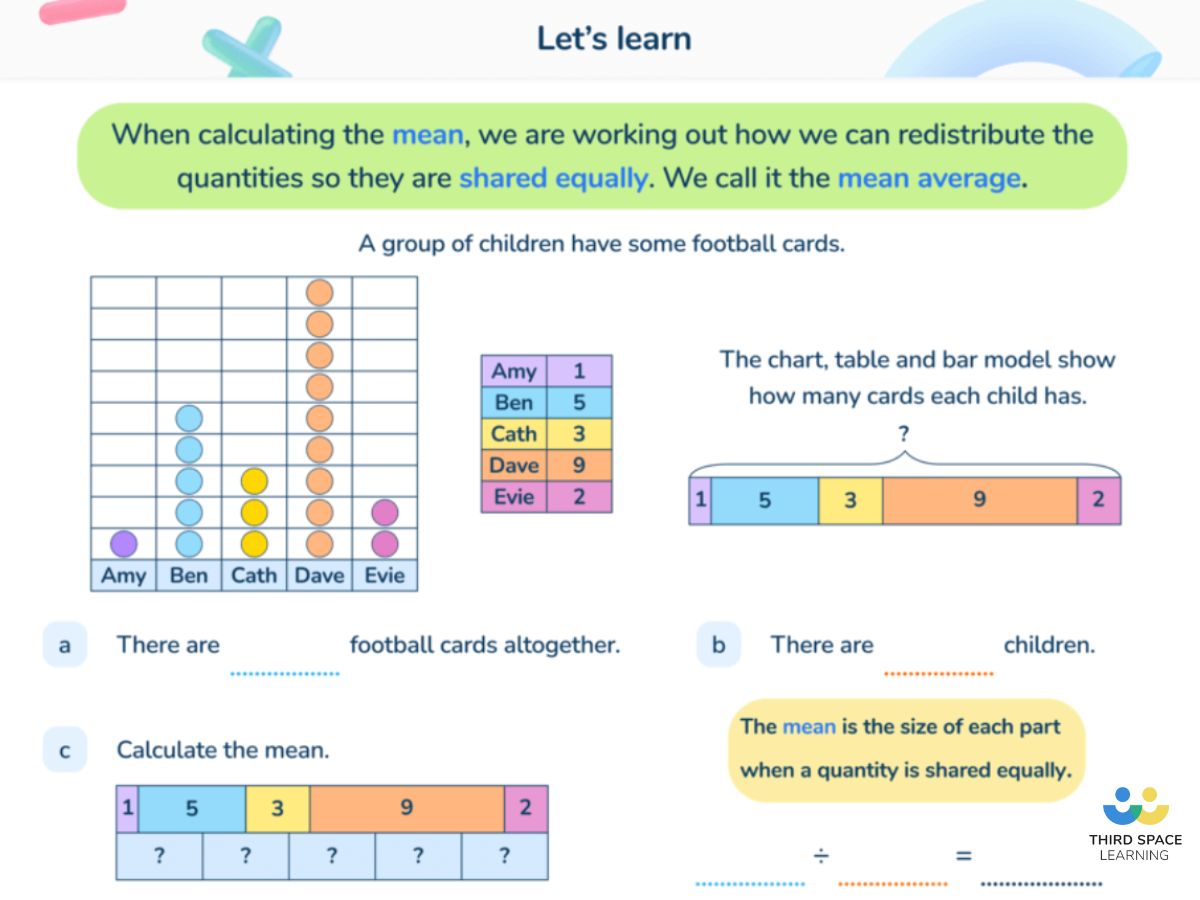
In the image, the children have these numbers of cards:
| Child | Cards |
|---|---|
| Amy | 1 |
| Ben | 5 |
| Cath | 3 |
| Dave | 9 |
| Evie | 2 |
First find the total:
There are children, so share the total equally between :
Therefore,
This does not mean every child originally had 4 cards. It means that if the 20 cards were redistributed fairly, each child would have 4.
See the method once, then use it reliably
Watch this short explanation before continuing. It gives a clear visual reminder of the two essential actions: total, then divide by the number of values.
Finding the Mean (Average) | Math with Mr. J
Watch “Finding the Mean (Average)” by Math with Mr. J for a concise demonstration of the method using small sets of numbers.
Watch the introduction to establish the two-step rule. Then watch the first example, pausing briefly to identify the total and the number of scores before the answer is calculated. Continue through the second example to see that the same method works for a larger set, and finish with the summary.
A careful written layout helps prevent the most common mistake: dividing by the wrong number.
Suppose a scientist records the number of bubbles produced in five equal time intervals:
Write the calculation in full:
Add the values:
Then divide by the five observations, not by one of the values:
So the mean number of bubbles per interval is:
The phrase “per interval” matters. A mean should normally keep the unit of the original data:
- mean mass is measured in grams or kilograms;
- mean time is measured in seconds or minutes;
- mean test score is measured in marks;
- mean number of bubbles is measured in bubbles per interval.
A dependable calculation structure
For a small data set, use this template:
For example, five pupils record how many minutes they brushed their teeth on different evenings:
The total is:
There are recorded evenings:
The mean brushing time in this small data set is minutes.
Notice what was counted:
- There are five numbers, so divide by .
- Do not divide by the largest number, .
- Do not divide by the total, , a second time.
This may sound obvious, but counting the observations accurately is as important as doing the addition accurately.
Why the answer can be a decimal
A mean can be a number that never appeared in the data.
Suppose four trays in a school science experiment produce these numbers of seedlings:
The total is:
There are trays:
Here the mean is a whole number, , even though no tray actually had exactly 8 seedlings.
Now consider the measurements:
The total is:
There are measurements:
So the mean is:
It would not make sense to say that one tray literally grew of a seedling. The mean is a summary of the whole set: the equal-share value.
Checking whether a mean is sensible
Before accepting an answer, make two quick checks.
Check 1: Is the mean between the smallest and largest values?
For ordinary numerical data, the mean must lie between the minimum and maximum.
For the values:
the smallest value is and the largest is . The mean lies between them, so it is plausible.
If you calculated as the mean, you would immediately know something had gone wrong: is the total, not the average.
Check 2: Does the answer fit the balance of the data?
Values below the mean and values above the mean balance each other overall.
For:
the mean is . Compared with :
| Value | Difference from 4 |
|---|---|
| below | |
| above | |
| below | |
| above | |
| below |
The total amount below is:
The total amount above is:
So the data balance at . This is the mathematical reason that the “equal sharing” picture works.
Read a worked example and compare its method
Mean, median, mode and range - BBC Bitesize
Read the “Mean” section from BBC Bitesize. It gives two worked examples and highlights an important fact: the mean need not be one of the data values.
In the subsection “Mean,” begin at the sentence the first worked example. Follow the addition carefully, then identify why the division is by 5. Continue with the dice-throw example immediately below it and notice that its answer is a decimal because the total is not shared evenly among 10 throws.
When you compare your working with the BBC examples, focus on the structure rather than trying to memorise a particular answer:
That structure works for marks, lengths, times, counts, and many repeated scientific measurements.
Common errors to avoid
Stopping after addition
For the data:
the total is:
But is not the mean. There are four values:
The mean is .
Dividing by the wrong count
For:
the total is . There are values:
You must divide by , even though does not appear in the data.
Rounding too early
If the mean is:
keep sufficient accuracy while working. If a question asks for a rounded answer, round only at the end. For example, to one decimal place:
Forgetting what the data represents
A mean only makes sense when the values measure the same kind of thing in compatible units. You could find the mean of several toothbrushing times, but not the mean of a time, a mass, and a test score mixed together.
A final model example
A dental clinic records the number of missed appointments on five Mondays:
Calculate the mean number of missed appointments.
First, find the total:
Then count the five Mondays:
Therefore, the mean number of missed appointments per Monday is:
This is a useful summary, but it does not claim that every Monday had exactly three missed appointments. The individual weekly values still matter, especially because they vary from to .
Key takeaways
The mean is an equal-share average:
To calculate it:
- Add every value once.
- Count the number of values.
- Divide the total by that count.
- Check that the answer lies between the smallest and largest values.
- Include an appropriate unit or context, such as “minutes,” “marks,” or “per day.”
A mean may be a decimal and may not appear anywhere in the original data. It is still meaningful as the value each observation would have if the total were shared equally.
Next lesson, you will interpret bar charts and line graphs—another way of displaying scientific and dental data before answering questions from it.
Can't find a good explanation? Sign up and we'll make it for you
Sign up