
Hello! Welcome back to our module on "Incrementality and True Marketing Impact."
In our last lesson, we established what incrementality is and why it's a critical concept for any marketing leader. We defined it as the measure of causal impact—the sales and conversions that happened only because of your marketing efforts. We also clarified how it differs from attribution, positioning it as a tool for strategic budget allocation.
Today, we move from the "what" and "why" to the "how." Our learning outcome is to critique the design of common incrementality tests (geo-lift, conversion lift, holdouts). As a leader, you won't necessarily be building these tests from scratch, but your ability to scrutinize their design is paramount. Trusting a multi-million dollar budget decision to a poorly designed test is a risk you can't afford to take. We'll explore the methodologies, their strengths, and, most importantly, their weaknesses.
1. The Methodological Landscape
There are several ways to structure an incrementality test, each with different levels of precision and feasibility. The core principle remains the same: compare a group that sees your marketing (test group) with a similar group that does not (control group).
Incrementality Testing in Digital Marketing & testing architecture
To get a quick overview of the main test types, let's watch a short segment from the 'Senator We Run Ads' video we saw in our last lesson. This will frame our discussion.
Please watch from 03:32 to 05:45. The presenter briefly introduces four methods: time-based split, geo-split, audience split, and ghost ads. We will be diving deeper into the most important of these: audience splits and geo-splits.
As the video outlines, the primary methods involve splitting your audience by time, geography, or directly at the user level. We'll focus on the latter two, as they form the basis of the most robust and common tests you'll encounter.
2. The Gold Standard: User-Level Holdouts (Conversion Lift)
The most scientifically rigorous method is the Randomized Controlled Trial (RCT), where individual users are randomly assigned to either the test or control group. In the digital marketing world, this is often called a user-level holdout or, as branded by platforms like Meta and Google, a Conversion Lift study.
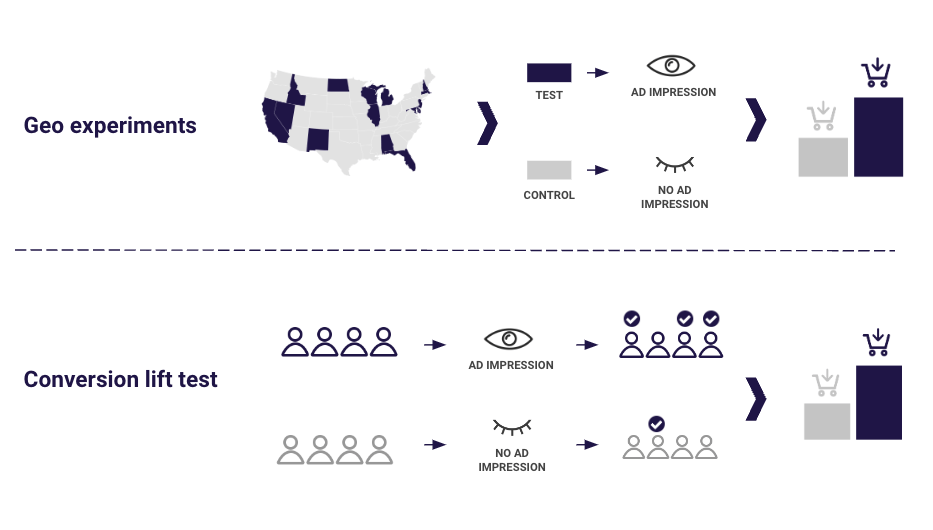
Because individual users are the unit of randomization, this method provides the cleanest and most precise measure of causality, assuming the test is designed correctly.
The Incrementality Imperative: A Comparative Analysis of ...
This article from Appier, 'The Incrementality Imperative', provides an excellent overview of how major platforms approach this. It clearly explains the design of user-level holdouts.
Please read the sections on 'Randomized Controlled Trials (RCTs)' and then scan the tool deep dives for Google's 'Conversion Lift' and Meta's 'Conversion Lift Study (CLS)'. Focus on understanding the core design: randomly splitting users into a test (treatment) group and a control (holdout) group.
Critiquing a Conversion Lift / Holdout Test
When your analytics team or a platform vendor presents the results of a conversion lift study, your critique should center on three key areas:
-
Quality of Randomization: The fundamental assumption is that the test and control groups are "probabilistically equivalent"—meaning, before the test starts, they have the same characteristics and propensity to convert. True randomization ensures this.
- Question to Ask: "How were users assigned to the groups? Can you confirm it was a truly random split at the user-ID level, not based on cookies or other less reliable identifiers?" Identity-level randomization (like a Facebook User ID or Google Account) is crucial because it tracks the user across devices, preventing someone from being in the test group on their phone and the control group on their laptop.
-
Cleanliness of the Control Group: The control group must remain "clean," meaning they are not inadvertently exposed to the ads being tested. This is called avoiding contamination.
- Question to Ask: "What mechanisms are in place to ensure the holdout group is fully excluded from this campaign's ads for the duration of the test?" Major platforms like Meta and Google manage this on the back end, but it's a critical question for any third-party or in-house solution.
-
Statistical Power: A test needs enough data (specifically, enough conversions) to produce a reliable result. If you're testing a low-volume product, you might not have enough "power" to detect a real lift, leading to an inconclusive result.
- Question to Ask: "Did we conduct a power analysis beforehand? What was the 'minimum detectable effect' we were looking for, and did the test have a high enough feasibility rating to achieve a statistically significant result?" As the Appier article notes, Google provides a feasibility rating for this very reason.
A well-designed user-level holdout test is the most trustworthy method for measuring incrementality. Your role is to ask the right questions to verify the design's integrity.
3. The Geographic Alternative: Geo-Lift / Matched Market Tests
What happens when you can't randomize at the user level? This is common for channels like TV, radio, direct mail, or even digital campaigns where platform tools are limited. The next best alternative is a geo-lift test, also known as a matched market test.
As shown in the image above, this method involves dividing geographic regions (cities, states, postcodes) into test and control groups. Ads are run in the test regions but not in the control regions.
Critiquing a Geo-Lift Test
While powerful, geo-lift tests have more potential pitfalls than user-level RCTs. Your critique should be even sharper here.
-
The Quality of the Match: The entire test hinges on how well the control markets serve as a "clone" for the test markets. Poor matching leads to biased results. For example, comparing a market with a young, urban population to one with an older, rural population is unlikely to be valid.
- Question to Ask: "How were the test and control markets matched? What variables were used—historical sales data, demographics, seasonality trends? How similar were the markets before the test began?"
-
The Inherent Variance and Uncertainty: This is the most critical and subtle point of critique for geo-tests. Even with perfect matching, there is natural, random fluctuation in every market. A single geo-test might show a positive lift purely by chance. A foundational 2017 paper by researchers from Northwestern University and Facebook analyzed this very problem. They simulated matched market tests using data where they already knew the "true" lift from an RCT.
They found that the results had enormous variance. In one study where the true lift was 33%, their simulations of 40-market geo-tests produced results ranging from -2% to +80%.
This means that a single geo-test, even with 40 markets, can be highly misleading. It might tell you the lift is 70% when it's really 30%, or that the lift is 0% when it's positive.
- Question to Ask: "This is a single experiment. Given the inherent volatility of geo-testing, how much confidence do we have in this specific result? Have you run simulations to understand the potential range of outcomes?" This question signals a sophisticated understanding of the method's limitations.
-
Spillover Effects: Can people in a control region be influenced by ads running in a nearby test region (e.g., commuters, regional news)? This can contaminate the control group and understate the true lift.
- Question to Ask: "How did we account for potential spillover effects between our test and control regions?"
Geo-lift tests are a valuable tool, but you must treat their results with a healthy dose of skepticism and understand that a single result is a data point, not absolute truth.
Test your understanding!
Your analytics team presents two incrementality study proposals:
- Proposal A: A Meta Conversion Lift Study for a new prospecting campaign, targeting a broad audience.
- Proposal B: A Geo-Lift test for a new out-of-home (billboard) campaign, using 10 test cities and 10 matched control cities.
Which proposal's results would you inherently trust more, and what is the single most important critical question you would ask about Proposal B?
Show answer
You should inherently trust the results of Proposal A (Meta Conversion Lift Study) more. Because it's a user-level RCT, it eliminates many of the confounding variables and selection biases that are challenging in a geo-test. The randomization happens at a much more granular and reliable level.
The single most important question for Proposal B is about the quality and similarity of the matched markets. You would ask: "How did you determine the 10 control cities were a valid proxy for the 10 test cities? What data (e.g., historical sales, demographics, media consumption habits) was used to create the match, and can you show me the pre-test trend alignment?" The validity of the entire experiment rests on the answer to this question. A secondary, but equally important question, would address the high variance of geo-tests.
4. Variations on a Theme: The Control Group Design
A final, subtle point of critique is the specific design of the control group. What exactly are they seeing (or not seeing) instead of your ad?
-
Standard Holdout (in RCTs): In a well-designed platform test (like on Meta/Google), the control group doesn't just see a blank space. They are shown the ad that would have won the ad auction if your campaign hadn't existed. This correctly measures your ad's lift against the next best alternative, which is the most relevant business question.
-
Public Service Announcement (PSA) / Ghost Ads: In this design, the control group is shown a "placebo" ad—like a charity ad or a generic, unbranded ad. The idea is to control for the effect of simply seeing any ad.
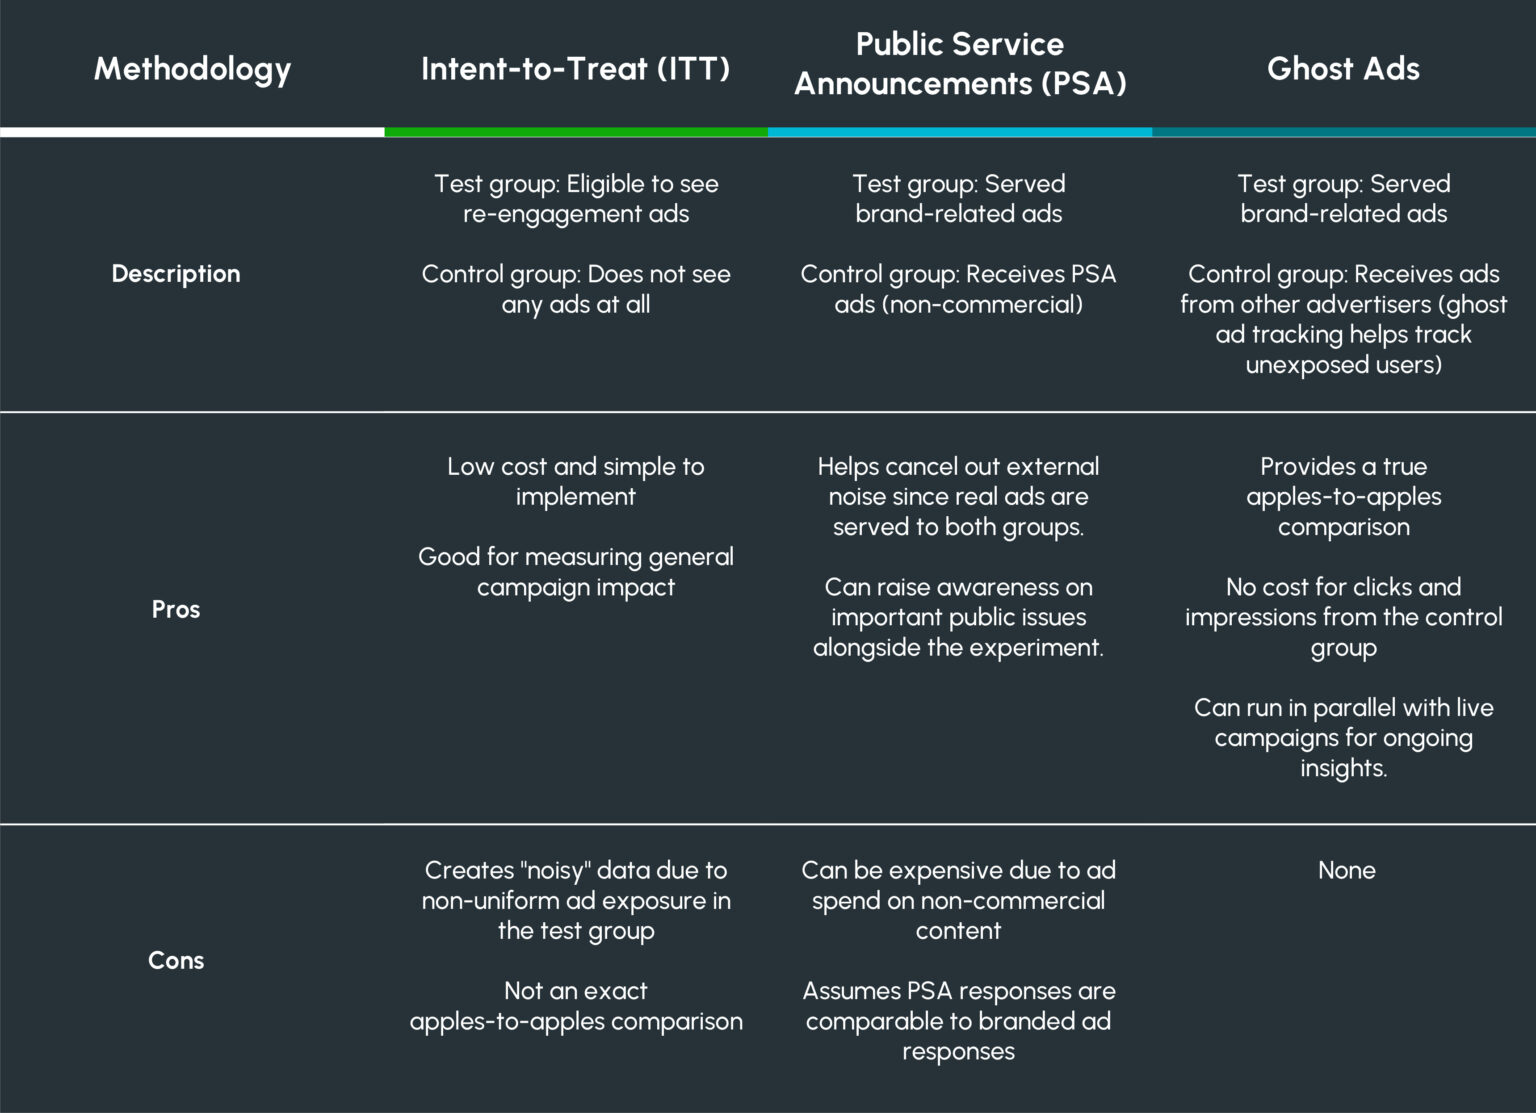
While PSAs seem clever, they have a major potential flaw. Ad platforms optimize delivery for each campaign separately. The platform might learn that your product ad works best with one demographic, while the PSA ad works best with another. Over time, this can break the "probabilistic equivalence" between the groups and lead to biased results. The same Facebook/Kellogg paper found a case where a PSA test reported a misleading negative lift, while the true lift was positive, likely due to this optimization divergence.
- Question to Ask (for PSA tests): "How are we ensuring that the platform's optimization algorithms for our main ad and the PSA ad don't cause the test and control audiences to diverge over time?"
Conclusion
Critiquing incrementality test design is about being an educated and skeptical leader. You need to understand the trade-offs between different methodologies to properly weigh the evidence presented to you.
Key Takeaways:
- User-Level Holdouts (Conversion Lift): The gold standard. Your critique should focus on the quality of randomization, the cleanliness of the holdout, and statistical power.
- Geo-Lift (Matched Markets): A necessary alternative when user-level is not possible. Your critique must focus on the quality of the market matching and, crucially, acknowledge the high potential for variance in a single test result.
- Control Group Design Matters: Understanding whether the control is a true holdout or a PSA group is important, as each has different implications. PSA tests can be biased by diverging optimization.
- Your Role is to Question: By asking pointed questions about randomization, matching, contamination, and variance, you ensure your organization makes strategic decisions based on reliable, causal data.
Preview of the Next Lesson:
Now that we know how to critique the design of a test, our next step is to interpret its output. We will learn how to read the results—including lift percentages, confidence intervals, and p-values—to determine a channel's true causal impact and make a confident business decision.