
Hello! Welcome to the next lesson in our journey through advanced performance marketing.
In our last session, you learned how to be a critical consumer of analytics by formulating key questions to ask your team about incrementality results. You now have the toolkit to pressure-test their findings, understand the limitations, and build confidence in the data.
But having a confident, nuanced understanding is only half the battle. As a leader, your ultimate job is to use that understanding to influence business strategy. This requires translating complex analytical findings into a simple, persuasive narrative for an executive audience.
Today, we will focus on exactly that. Our learning outcome is to develop a communication strategy for explaining incrementality findings to executives. We'll move from interrogating the data to championing the insights, ensuring they drive meaningful action like budget re-allocation and strategic shifts.
1. The Executive Mindset: From Data to Decisions
Before you even think about building a slide, you must shift your perspective from that of an analyst or a marketer to that of a CEO or CFO. Your executive team operates on a different wavelength. They are not interested in the methodological details of your geo-lift test; they are interested in profit, growth, and competitive advantage.
To communicate effectively, you must speak their language.
5 Rules for Communicating Effectively with Executives
Dr. Grace Lee's video, '5 Rules for Communicating Effectively with Executives', offers a concise and powerful guide to adopting the right mindset for these high-stakes conversations.
Please watch the entire video. As you watch, pay close attention to the five rules and think about how they apply to presenting a complex marketing analysis.
Let's summarize how these five rules translate directly to presenting incrementality findings:
- 1. Escape the Minutiae: Instead of explaining confidence intervals or p-values, talk about the business implication.
- Don't say: "The test group showed a statistically significant lift of 12% with a 95% confidence interval of 8-16%."
- Do say: "We are highly confident that this channel is generating real, incremental revenue."
- 2. Exude Unshakable Confidence: Your deep dive in the previous lesson should give you this confidence. You've asked the hard questions, so you know the strengths and weaknesses of the data. Project that certainty.
- 3. Execute Rain-Making Conversations: Frame your findings in terms of money. Incrementality is the perfect tool for this.
- Don't say: "The campaign drove a 10% lift in conversions."
- Do say: "This campaign generated $1.5M in incremental revenue at an incremental ROAS of 3.2, meaning every dollar invested created $3.20 in real profit contribution."
- 4. Elongate Your Time Frames: Connect the one-off test result to the company's long-term vision. Explain how these insights will make all future marketing spend more efficient.
- 5. Exercise Business Acumen: Show that you understand this isn't just about marketing performance, but about overall business health. Acknowledge trade-offs and connect your recommendation to the company's financial goals.
2. Structuring Your Narrative: The SCR Framework
The most effective executive communications follow a simple, logical story structure. One of the most powerful is the Situation-Complication-Resolution (SCR) framework, famously used by consulting firms like McKinsey. It’s designed to quickly align your audience, introduce a tension or problem, and then solve it with your recommendation.
Storytelling in PowerPoint: Learn McKinsey’s 3-Step Framework
This video from Dan Galletta, 'Storytelling in PowerPoint', breaks down the SCR framework in a very practical way. It shows how to build a persuasive storyline before you even open PowerPoint.
Please watch from the beginning to the 8:47 mark. Focus on understanding the SCR (or SCQA) structure and the 'dot-dash' method for outlining your story.
Let's apply the SCR framework directly to an incrementality scenario:
-
Situation: Establish a shared context that everyone agrees on.
- Example: "This quarter, we invested $2M in our Facebook retargeting campaigns. The platform is reporting a strong 5.0x ROAS, which has historically met our efficiency targets."
-
Complication: Introduce the problem or tension that disrupts the situation. This is where you explain why the status quo isn't good enough.
- Example: "However, platform-reported ROAS is misleading. It doesn't distinguish between sales we caused versus sales we simply got credit for. We suspect a significant portion of this 5.0x ROAS is from customers who would have bought from us anyway, meaning we might be over-investing in this channel."
-
Resolution: Present your findings and recommendation as the clear solution to the complication.
- Example: "To find the true causal impact, we ran a conversion lift study. The results show the incremental ROAS is only 1.8x. Based on this, we recommend reallocating 50% of the retargeting budget to our new influencer program, which a separate test showed has an incremental ROAS of 3.5x. This single move is projected to increase total incremental revenue by $800k next quarter."
This structure turns a dry data report into a compelling business case. It creates a narrative arc that logically leads the audience to your conclusion.
Test your understanding!
Imagine your incrementality test found that a channel everyone assumed was a top performer (e.g., Branded Search) has a near-zero incremental impact. Using the SCR framework, how would you structure the narrative to present this challenging finding to executives?
Show answer
Here's a possible SCR structure:
- Situation: "We currently spend $500k per quarter on Branded Search to defend our brand term and capture high-intent users. It's our highest-performing channel on paper, with a platform-reported ROAS of 25x."
- Complication: "While these numbers look impressive, the core business question is whether these ad clicks are truly causing sales, or if we are just paying to acquire customers who were already coming to us. If the impact isn't incremental, this $500k could be better used to fund actual growth."
- Resolution: "We conducted a geo-experiment where we paused Branded Search in several matched markets. We found no statistically significant drop in total sales in those regions, meaning the channel has a near-zero incremental lift. Our recommendation is to pause all Branded Search spend and re-invest that $500k into mid-funnel YouTube campaigns to drive new customer acquisition, which we project will generate an additional $1.2M in incremental sales next quarter."
This framing turns a potentially "negative" finding into a positive business opportunity.
3. From Narrative to Deck: A Practical Template
Now that you have your story straight, you can build the slides. The key is to let the narrative drive the content, not the other way around. Each slide should represent a key "dot" in your dot-dash outline.
The article "4 slides that every marketing QBR deck needs" provides an excellent, executive-friendly template for presenting performance data. We can adapt this structure to tell our incrementality story with maximum impact.
4 slides that every marketing QBR deck needs
The article '4 slides that every marketing QBR deck needs' from Paramark gives a concrete blueprint for what executives want to see. We will use this as a model for our incrementality presentation.
Please read the sections for all four recommended slides: 'Baseline performance vs incremental marketing contribution', 'Incremental marketing impact by channel', 'Cost of acquisition', and 'Forecasting'. Notice how each slide answers a specific business question.
Here is a plan for your presentation, combining the SCR framework with this slide structure:
Slide 1: The Executive Summary (The "Resolution")
- Purpose: Answer the most important question first. Don't bury the lead.
- Content: A single, clear statement of your main finding and recommendation.
- Example Title: "Incrementality tests reveal an opportunity to unlock $800k in additional revenue by reallocating budget from Facebook to Influencer marketing."
- Visual: Minimal text. Maybe two boxes: "Current State" and "Recommended State" with the top-line financial impact.
Slide 2: The Big Picture: Marketing's True Contribution (The "Situation")
- Purpose: Establish the overall value of marketing, grounded in incrementality.
- Content: Use the "Baseline vs. incremental marketing contribution" chart from the article. Show total business results, and then break it down into "Baseline (what we'd get anyway)" and "Incremental Impact from Marketing."
- Example Title: "Marketing drove $15M in incremental revenue this quarter."
Slide 3: The Key Finding: Channel Incrementality (The "Complication")
- Purpose: This is where you reveal the core insight that creates the tension in your story.
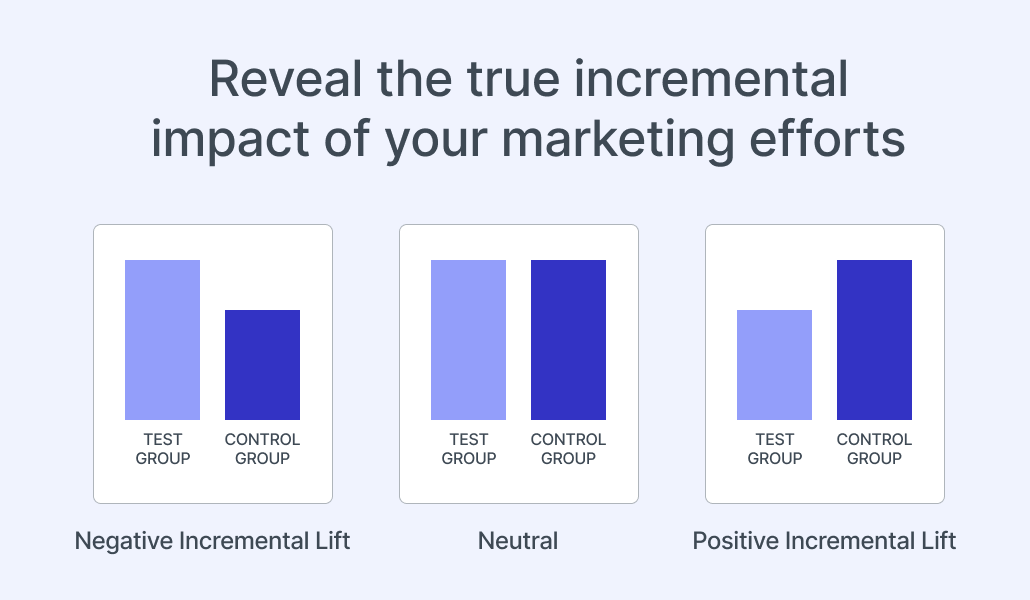
- Content: Use the "Incremental marketing impact by channel" chart. You can modify it to show a comparison between Platform-Reported Contribution and Incremental Contribution for key channels. This visual contrast is extremely powerful.
- Example Title: "Facebook reports a 5x ROAS, but its true incremental impact is only 1.8x."
Slide 4: The Recommendation & Financial Forecast (The "Resolution," detailed)
- Purpose: Clearly state the proposed action and its expected financial outcome.
- Content: Combine the "Cost of acquisition" and "Forecasting" concepts.
- Show a simple table:
Channel | Current Budget | Proposed Budget | iROAS. - Use the forecasting line graph to show the expected lift in total incremental revenue if your recommendation is adopted.
- Show a simple table:
- Example Title: "Recommendation: Shift $1M from Facebook to Influencers to increase total marketing iROAS from 2.5x to 2.9x."
Finally, remember the phased approach from the Recast article (LINK). You may need a "primer" slide at the beginning that gently educates the audience on why incrementality matters, perhaps using the simple example of branded search not being fully incremental. This builds the foundation for your subsequent findings.
Conclusion
Communicating incrementality findings to executives is a core leadership skill that blends analytical rigor with strategic storytelling. It’s your responsibility to bridge the gap between the complex world of data science and the fast-paced world of executive decision-making.
Key Takeaways:
- Speak the Language of Business: Frame every insight in terms of revenue, profit, and long-term value.
- Structure Your Narrative: Use the Situation-Complication-Resolution (SCR) framework to create a logical and persuasive story.
- Answer First, Explain Later: Start your presentation with the conclusion and recommendation.
- Visualize the Contrast: Use simple charts to show the gap between misleading platform metrics and true incremental impact.
- Connect Insights to Action: Every finding must be paired with a clear, specific, and financially-grounded recommendation.
The confidence to stand before the C-suite and recommend a multi-million dollar budget shift comes directly from the critical evaluation you learned to perform in our last lesson. You've done the work to trust the data; now you have the tools to make others believe in it too.
Preview of the Next Lesson:
So far, we've focused on incrementality tests (like geo-lift and conversion lift), which are powerful for getting deep, causal answers about specific channels. However, running these tests for every channel all the time is impractical. How can we get a more holistic, top-down view of our entire marketing mix to guide high-level strategy?
That's where Marketing Mix Modeling (MMM) comes in. In our next lesson, we will begin a new module on this topic, starting with the fundamentals: Explain the business purpose of MMM and the strategic questions it can answer.