
Hello! Welcome back to our course on advanced performance marketing.
In our last lesson, we focused on a critical leadership skill: developing a communication strategy to explain complex incrementality findings to executives. You learned how to frame data within a compelling narrative, focusing on business impact rather than technical details.
Today, we take the logical next step. Once you've successfully communicated the what and the why, you need to drive the action. This lesson is about making the tough, data-driven decisions that separate strategic leaders from tactical managers.
Our learning outcome is to justify budget shifts away from channels with low incrementality, even if they have high reported ROAS. This is one of the highest-leverage activities a marketing leader can perform, as it involves reallocating significant investment from seemingly successful channels to areas with greater true growth potential. We will build a robust framework for making and defending these critical decisions.
1. The Core Conflict: High ROAS, Low Impact
As a recap, you know that a channel's reported ROAS from a platform like Google Ads or Meta Ads can be misleading. It often includes conversions from users who would have purchased anyway (e.g., by clicking on a branded search ad when they were already on their way to your site). Incrementality testing helps isolate the causal impact of your ads.
This creates a common and challenging scenario for marketing leaders: a channel, let's say Retargeting, boasts a 10x ROAS in the platform dashboard, making it look like a star performer. However, an incrementality test reveals its actual, causal impact is only 1.5x.
The knee-jerk reaction might be to cut all spending. However, the correct decision is more nuanced. To justify a budget shift, you need to go beyond simply knowing a channel's overall incrementality. You need to understand its marginal performance.
Incrementality Testing in Digital Marketing & testing architecture
To quickly refresh on why this matters, this short video highlights the key strategic reasons companies are so focused on incrementality. It directly links the concept to better budget allocation.
Please watch the clip from 7:27 to 8:08. Pay attention to the bullet point 'improves budget allocation and saves budget'—this is the strategic context for today's lesson.
2. Average vs. Marginal Returns: The Key to Smart Allocation
The core concept you need to master to justify budget shifts is the difference between average return and marginal return.
- Average ROAS (or Platform ROAS): This is the total revenue attributed to a channel divided by the total spend. It's a backward-looking average. A 5x ROAS means that, on average, every dollar spent in the past generated five dollars in revenue.
- Marginal ROAS (mROAS): This measures the return on the next dollar you spend. It's a forward-looking metric that answers the question: "If I invest one more dollar in this channel, how much revenue will I get?"
Why is this distinction so critical? Because of the law of diminishing returns. The first dollars you spend in a channel target the most receptive audience and are highly effective. As you spend more, you have to reach less interested users, and your efficiency drops. A channel might have a great average ROAS, but its marginal ROAS could be very low, or even negative, meaning you're losing money on every additional dollar spent.
The following article provides an excellent real-world example of this principle in action.
Why You Should Avoid Using Target ROAS Bidding in Ad Platforms
To understand why a high average ROAS can be deceptive, we need to grasp the difference between 'average' and 'marginal' returns. This article provides a clear, practical example.
Please read the sections 'Understanding Marginal ROAS vs. Average ROAS' and 'Real-World Example'. Focus on the comparison between Campaign A (Paid Search) and Campaign B (Display Ads). Pay close attention to why investing in Campaign B, the one with the lower average ROAS, was the correct business decision.
As the article demonstrates, allocating budget based on the highest average ROAS led to a lower overall return. The correct decision was to allocate the additional budget to the campaign with the highest marginal ROAS, even though its average ROAS was lower.
This is the foundation of your justification: You allocate budget not based on past average performance, but on future marginal potential.
Test your understanding!
You are managing two channels:
- Channel A: Spends $50,000/month, generates $250,000 in revenue. (Average ROAS = 5.0x)
- Channel B: Spends $50,000/month, generates $150,000 in revenue. (Average ROAS = 3.0x)
Your analytics team tells you that due to saturation, the marginal ROAS for Channel A is now 0.9x. Channel B still has room to grow, and its marginal ROAS is 2.5x.
You have an extra $10,000 to spend. Where do you put it, and why?
Show answer
You should allocate the $10,000 to Channel B.
Justification: While Channel A has a superior historical average ROAS (5.0x), its marginal ROAS is only 0.9x. This means for every additional dollar spent, you only get 90 cents back—a loss. In contrast, Channel B's marginal ROAS is 2.5x, meaning every additional dollar will generate $2.50 in revenue. Investing in Channel B will increase your total portfolio return, even though it has a lower average ROAS.
3. A Practical Framework: ROAS vs. iROAS vs. miROAS
To make this framework operational, it helps to use a precise vocabulary. Let's refine our terms.
- ROAS: The misleading, platform-reported metric.
- iROAS (Incremental ROAS): The true, average causal return. It's
Incremental Revenue / Spend. This tells you how a channel performed historically. - miROAS (Marginal Incremental ROAS): The return on the next incremental dollar. This tells you how a channel will perform in the future if you increase spend.
This next resource provides a brilliant summary of when to use each metric.
ROAS, iROAS, miROAS: Choosing the Right KPI for ...
The concepts of incremental and marginal returns are so critical that a specific vocabulary has emerged. This article from Sellforte provides a clear framework for which metric to use for which decision.
Please read the 'Key Takeaways' at the top, then quickly review the definitions. Pay close attention to the sections 'How to Use iROAS...' and 'How to Use miROAS...' and the final 'Summary & Conclusions'. The goal is to understand why iROAS is for measuring the past and miROAS is for optimizing the future.
Here is the decision-making framework in a nutshell:
- Use iROAS to evaluate past performance. A high iROAS confirms a channel was a valuable investment.
- Use miROAS to make future budget allocation decisions.
- If miROAS > Target, you should increase spend.
- If miROAS < Target, you should decrease spend.
This gives you the complete justification narrative:
"Our analysis shows Channel X (e.g., Retargeting) has a reported ROAS of 10x, and a true incremental ROAS (iROAS) of 4x. This confirms it has been a valuable part of our mix. However, we've reached saturation, and its marginal incremental ROAS (miROAS) has now fallen to 1.2x, which is below our profitability target of 1.5x.
In contrast, Channel Y (e.g., TikTok Prospecting) has a lower iROAS of 3x but its miROAS is currently 2.5x, well above our target.
Therefore, I am recommending we shift $200k from Channel X to Channel Y. This move will sacrifice some low-return spend for high-return spend, increasing our total marketing portfolio's incremental return and driving more profitable growth."
4. Visualizing the Decision
As a leader, you'll often need to present this justification in a simple, visual format. A dashboard or table that contrasts platform metrics with incremental and marginal metrics is incredibly powerful.
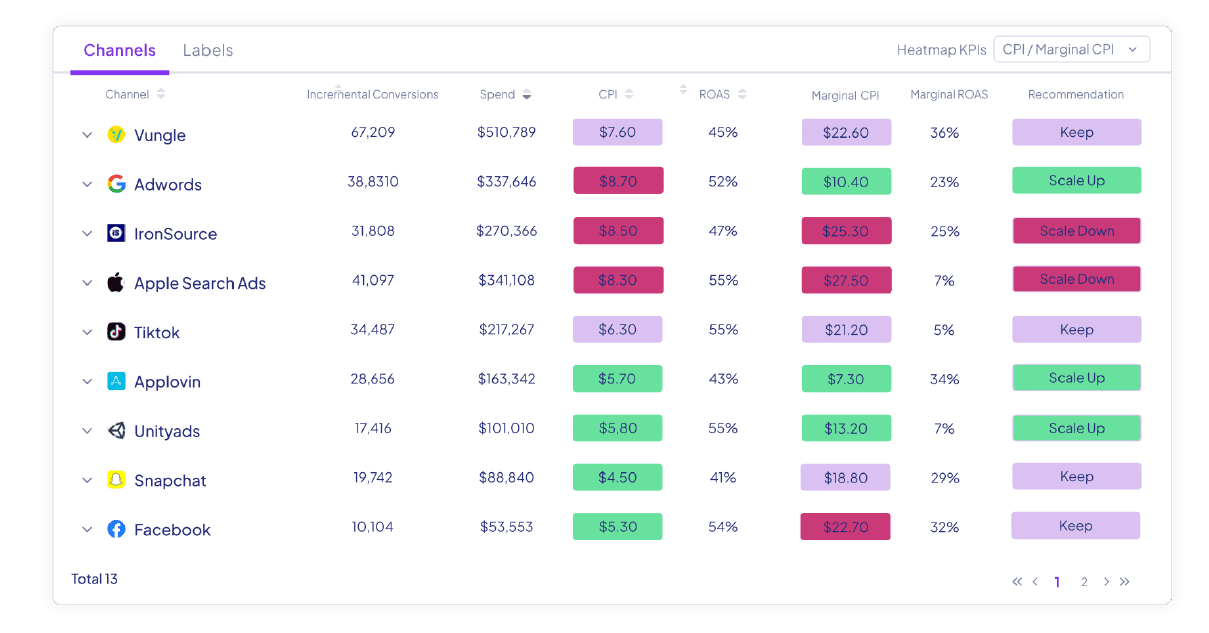
Look closely at the Apple Search Ads row in this example:
- ROAS: 55% (looks great!)
- Marginal ROAS: 7% (looks terrible!)
- Recommendation: Scale Down
Now look at TikTok:
- ROAS: 33% (looks okay, but worse than Apple)
- Marginal ROAS: 28% (still very healthy!)
- Recommendation: Scale Up
This single visual encapsulates the entire justification process. It acknowledges the misleading platform ROAS while basing the final decision on the forward-looking marginal metric.
Conclusion
Justifying budget shifts away from channels with low incrementality is a defining task for a data-driven marketing leader. It requires moving beyond simplistic, platform-reported averages and embracing a more sophisticated view of performance based on marginal returns.
Key Takeaways:
- High Average ROAS can hide low Marginal ROAS. The law of diminishing returns means that past success doesn't guarantee future efficiency.
- Decisions are about the next dollar. Your goal is to allocate capital where the next dollar invested will generate the highest return. This is measured by Marginal Incremental ROAS (miROAS).
- Use a tiered framework for metrics:
- ROAS (Platform): For tactical, in-platform optimization.
- iROAS (Incremental): To evaluate a channel's historical value.
- miROAS (Marginal Incremental): To make forward-looking budget allocation decisions.
- Your justification narrative is key: Acknowledge the high reported ROAS, confirm the historical value with iROAS, but make the case for change based on a low miROAS.
By mastering this framework, you can confidently defend seemingly counter-intuitive decisions and ensure your marketing budget is always working as hard as it can to drive profitable growth.
Preview of the Next Lesson:
We've now established that miROAS is the gold standard for budget allocation. But where does this number come from? While lift tests are great for calculating iROAS, determining a channel's entire response curve to calculate miROAS requires a more holistic, top-down approach.
This brings us to the next module in our course: Marketing Mix Modeling (MMM). In our next lesson, we will begin our exploration of this powerful technique by covering the first learning outcome: Explain the business purpose of MMM and the strategic questions it can answer.