
Hello! In the previous lesson, you used integers to describe situations such as temperatures below zero, elevations below sea level, and money gained or owed. The key idea was that zero is a reference point.
Now we will make that idea visual. A number line shows the location of an integer: positive integers lie on one side of zero, negative integers lie on the other, and zero is the central reference point. By the end of this lesson, you will be able to mark any given integer accurately, even when a number line uses a scale other than one unit per tick.
Reading a number line
A number line is a straight line with equally spaced marks, called ticks. Each tick represents a number. The distance from one tick to the next must represent the same amount everywhere on that number line.
On a usual horizontal number line:
- values increase as you move to the right;
- values decrease as you move to the left;
- separates negative and positive integers.
On a vertical number line, the usual convention is:
- positive values are above ;
- negative values are below .
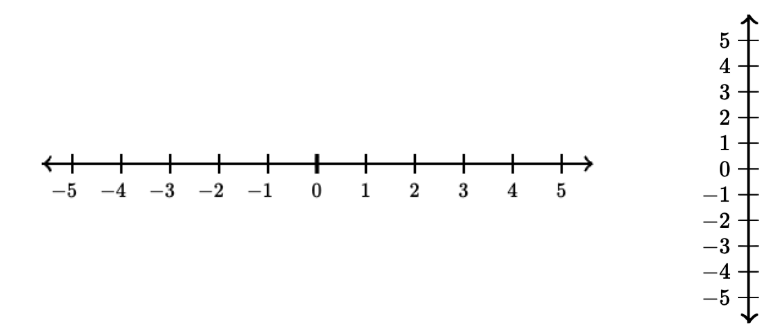
Notice two details in the image:
- The tick marks are evenly spaced.
- The labels change by at each tick: .
A point placed on the tick labeled represents the integer . A point placed on the tick labeled represents .
The basic plotting method
To plot or graph an integer means to place a point exactly at that integer’s position on the number line.
Use this dependable routine:
- Find . It is your starting reference point.
- Read the sign.
- A positive integer goes right on a horizontal line.
- A negative integer goes left on a horizontal line.
- stays at the zero tick.
- Use the magnitude—the number without its sign—to decide how many equal intervals to count.
- Mark a clear dot on the correct tick and label it if the question asks you to name the point.
For example, to plot :
- Start at .
- The negative sign tells you to move left.
- The tells you to count four equal intervals.
- Put the point on the tick labeled .
To plot :
- Start at .
- Since is positive, move right.
- Count three equal intervals.
- Put the point on the tick labeled .
To plot , simply place the point directly on the tick labeled . You do not move in either direction.
How To Graph Numbers on a Number Line - Integers, Decimals, Fractions, and Square Roots
Watch “How To Graph Numbers on a Number Line” by The Organic Chemistry Tutor for a quick visual demonstration of the exact method: start at zero, then count left or right.
Watch plotting integers. Pay attention to how the presenter treats 0, 3, and -4 differently: zero is already at the center, while the sign determines the direction of travel.
A useful way to say your work aloud is:
“I start at zero, move left or right according to the sign, and count the required number of intervals.”
Saying the direction makes it much harder to accidentally put a negative number on the positive side.
Why the sign and the number both matter
Every nonzero integer gives you two pieces of information:
| Integer | Direction from | Number of intervals |
|---|---|---|
| right | ||
| left | ||
| right | ||
| left |
The sign does not tell you how far to move. It tells you which direction to move.
For instance, is not “negative seven spaces.” It is a location seven equal intervals left of zero. Likewise, is seven equal intervals right of zero.
This connects directly to the contexts from the last lesson:
- On a temperature number line, is four degrees below .
- On an elevation line, is thirty meters below sea level.
- On a bank-balance line, represents a balance twenty units below zero.
The context changes, but the number-line location works the same way.
Check the scale before plotting
Many classroom number lines count by ones, but not all of them do. Before plotting, inspect the labels to find the scale: the value represented by one interval.
For example, imagine a number line labeled , , , , , , . Each tick changes by , not by .
If you need to plot , you must place your dot at the tick labeled . It would be incorrect to count four tick marks left from zero, because each tick is worth units.
When two labeled values are separated by several tick intervals, calculate the scale carefully:
Suppose and have one unlabeled tick between them. There are two equal intervals from to , and the total value changes by . Therefore each interval is worth , so the middle tick must be .
The most important habit is this:
Count intervals, not just visible tick marks—and make sure you know what each interval is worth.
3.1 Introduction to Integers - Prealgebra 2e
Read this OpenStax section to reinforce how the number line is extended from zero and how positive and negative integers are plotted by counting equal units.
In the subsection “Locate Positive and Negative Numbers on the Number Line,” begin with the number line explanation. Focus especially on the paragraphs explaining that intervals stay the same width, positives are to the right of zero, and negatives are to the left. Then read Example 3.1, stopping before the subsection “Order Positive and Negative Numbers.” Follow the described movements from zero for each plotted point, even if the extracted text does not display every number clearly.
Common plotting mistakes
Here are the errors to watch for.
Putting negatives on the right
A negative sign means the number belongs left of zero on a standard horizontal number line. For example, cannot be placed to the right of .
Counting the wrong direction
Starting at is useful because it makes direction obvious. For , count left; for , count right.
Counting tick marks instead of intervals
If you begin at and move to the next tick, that is one interval. Continue counting the spaces between ticks: one, two, three, and so on.
Ignoring the scale
A tick is not always worth . It may represent , , , or another amount. Read the labels before you count.
Placing the dot between ticks on an integer line
If the number line is marked in integer-sized steps and you are graphing an integer, the point should usually sit on a tick, not halfway between two ticks.
Treating zero as positive or negative
Zero has its own location and is neither positive nor negative. A point representing belongs exactly at the zero tick.
A final accuracy check
Before you finish a graphing question, use this short checklist:
- Is the point on the correct side of ?
- Did I move the correct number of equal intervals?
- Did I check the scale of the number line?
- Is my point centered on the intended tick?
- If I labeled the point, does the label match the integer?
A point’s location is the meaning of the integer. On a number line, and are the same number of intervals from zero, but they are on different sides—so they represent different values.
Key takeaways
To represent an integer on a number line:
- Start from .
- Move right for a positive integer and left for a negative integer on a horizontal line.
- Count the number of equal intervals given by the number’s magnitude.
- Place a point precisely on the matching tick.
- Always check the scale; one interval is not necessarily worth .
Next, you will use this picture of the number line to identify opposites: pairs such as and , which sit the same distance from zero on opposite sides.
Can't find a good explanation? Sign up and we'll make it for you
Sign up