Hello! Welcome back to our series on fine-tuning diffusion models.
In our previous lessons, we've covered the complete pipeline from data preparation and training a LoRA with Kohya_ss to steering the final model at inference time with carefully crafted prompts and hyperparameters. We've learned how to build the model and how to use it. Now, we need to close the loop: how do we know if the model we built is any good?
This lesson addresses that crucial question, focusing on our learning outcome: Evaluate the quality of fine-tuned diffusion models and iterate on the training process. We'll move beyond just generating pretty pictures and learn to systematically assess your model's performance, diagnose common problems like overfitting, and use that knowledge to make your next training run even better. This is the feedback loop that turns training from a black box into an engineering discipline.
We will explore two complementary approaches:
- Qualitative Evaluation: The art of "eyeballing" your results in a structured way.
- Quantitative Evaluation: Using objective metrics to measure training progress and image quality.
1. Qualitative Evaluation: The Structured Eyeball Test
The most direct way to evaluate a model is to look at the images it produces. However, just generating a few random images isn't enough. A rigorous qualitative evaluation is systematic. It's about designing experiments to test the limits of your model.
A core part of this process is identifying two common failure modes you'll already be familiar with from your ML background: underfitting and overfitting.
Essential to Advanced Guide to training a LoRA
Let's start with a clear definition of these terms in the context of LoRA training. This guide from Civitai provides an excellent visual and textual explanation.
Read the first section, '[ESSENTIAL] Overfit and underfit'. Pay close attention to the visual signs of an overfit image: saturation, artifacts, and a 'fried' look.
- Underfitting: The model hasn't learned the concept well enough. For a character LoRA, this means the face, hair, or outfit is inconsistent or inaccurate. This is common in the early epochs of training.
- Overfitting: The model has memorized the training data too well. It loses flexibility and can only reproduce poses or compositions from your dataset. The images may also look burned, with harsh shadows and oversaturated colors. This happens in the later epochs.
Your goal is to find the "Goldilocks" checkpoint—the epoch that is well-trained but not yet overfit.
Systematic Comparison with XYZ Plots
The most powerful tool for this in UIs like Automatic1111 is the XYZ Plot. It allows you to generate a grid of images, comparing different variables. To find the best epoch from your training run, a typical setup would be:
- X-axis:
Prompt(with a few different test prompts) - Y-axis:
Checkpoint Name(selecting all the epoch checkpoints you saved) - Z-axis:
CFG Scale(testing a range like 5, 7, 9)
This single grid will instantly show you how your LoRA evolved. You'll see the early epochs struggling (underfitting), the middle epochs performing well, and the late epochs breaking down (overfitting). This is the single most effective technique for choosing which model file to use and share.
Ultimate Finetuning Guide For Stable Diffusion (Dreambooth, LoRA, Textual Inversion, Hypernets) 2023
Let's watch a practical example of comparing the outputs from different fine-tuning methods. While this video compares different techniques (LoRA, DreamBooth, etc.), the principle of systematic comparison is the same for evaluating different epochs of a single training run.
Watch the segment from 46:13 to 49:59. Notice the advice to use a consistent prompt and settings to compare results fairly. The presenter concludes that LoRA is often the best balance, but highlights its tendency to overfit on style (like always producing portraits if trained on them), which is a key issue you'll be looking for.
2. Quantitative Evaluation: Numbers and Graphs
While visual inspection is essential, quantitative metrics provide an objective measure of your model's training process and output quality.
Monitoring Training with TensorBoard
The most immediate quantitative feedback you have is the loss curve, which Kohya_ss logs during training. You can visualize this using TensorBoard.
The loss value represents how "wrong" the model's predictions are at each step. A steadily decreasing loss curve indicates that the model is learning.
How to use tensorboard to look at Stable Diffusion training logs
This video provides a clear, step-by-step guide on how to launch TensorBoard to view the logs generated by Kohya_ss. This is a fundamental skill for monitoring your training runs.
Watch from the beginning to 06:29. Focus on these key actions: Activating the correct Python virtual environment (venv). Launching TensorBoard from the command line, pointing it to your log directory (tensorboard --logdir ...). Selecting and overlaying different training runs to compare their loss curves directly.
As the video explains, you can compare the loss curves of different experiments. For example, you can train one model with a learning rate of 1e-4 and another with 5e-5 and overlay their loss curves to see which one converges faster or to a lower value.
However, be cautious: the lowest loss doesn't always equal the best model. A model that overfits will continue to drive the loss down on the training data, but its visual quality and flexibility will degrade. The loss curve is a health check, not a definitive measure of quality.
Essential to Advanced Guide to training a LoRA
The Civitai guide also touches on using the loss graph to select the best epoch. Let's revisit it for this specific point.
Read the section 'How to choose the "best" epoch'. It presents two methods: visual sampling (which we discussed) and analyzing the loss graph in Tensorboard. Note the strategy of looking for 'local minima'—points where the loss is low before it starts to get noisy or flatten out completely.
Objective Image Quality Metrics
For a more formal evaluation, researchers use metrics that compare generated images against prompts or a dataset of real images. While these are less common for casual LoRA training, understanding them is crucial for a deep knowledge of the field.
The Hugging Face Diffusers documentation provides a superb conceptual overview of the most common evaluation metrics. It explains what they measure and how they are used.
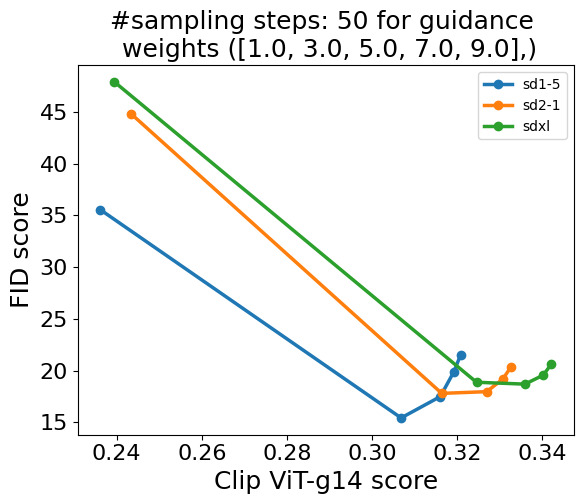
Please read the following sections: Introduction: This sets the stage, noting that a combination of qualitative and quantitative evaluation is best. Quantitative Evaluation (Intro): Briefly introduces the metrics we will cover. CLIP score: Understand that this measures how well the generated image matches the text prompt. Higher is better. It's a measure of prompt-alignment. FID (Fréchet Inception Distance): Understand that this measures the similarity between the distribution of generated images and a distribution of real images. Lower is better. It's a measure of realism and diversity.
- CLIP Score: Useful for checking if your model is accurately following a complex prompt.
- FID Score: Excellent for measuring the overall photorealism of a base model.
There is often a trade-off between these two metrics. Forcing a model to adhere very strictly to a prompt (high CLIP score) can sometimes make the image look less natural (higher FID). This is directly related to the CFG Scale we discussed in the last lesson.
3. The Iterative Loop: From Evaluation to Action
Evaluation is not a final step; it's the engine of iteration. Your goal is to use your findings to diagnose problems and propose changes for the next training run.
Let's walk through a practical troubleshooting example based on the Civitai guide.
Essential to Advanced Guide to training a LoRA
Now, let's see how to use our evaluation to diagnose and fix specific problems. This section of the LoRA guide is brilliant, showing an iterative process of identifying a flaw and fixing it by adjusting the dataset's tags.
Read the section '[BEGINNER] Testing and Fixing problems'. Follow the Jinx LoRA example. The trainer notices the generated outfit is wrong. By analyzing the dataset tags, they realize the tag navel was so frequent that its absence in a prompt caused the model to cover the stomach. The solution was to prune the navel tag and retrain.
This leads to a clear, repeatable workflow:
- Train: Train your LoRA and save checkpoints for several epochs.
- Evaluate:
- Check the TensorBoard loss curve for any obvious issues.
- Run an XYZ plot to visually compare epochs and find the best one.
- Test the best epoch with a wide range of prompts to find its failure points.
- Diagnose:
- Problem: "The model is underfit even at the last epoch." -> Diagnosis: Learning rate might be too low, or you need more steps/repeats.
- Problem: "The model overfits by epoch 2." -> Diagnosis: Learning rate is too high.
- Problem: "The character looks good, but the
blue hairtag also makes the eyes blue." -> Diagnosis: The concepts are "bleeding" into each other. The model has incorrectly associated blue hair with blue eyes from the training data.
- Iterate & Fix: Based on the diagnosis, take action.
- For learning rate/overfitting issues: Adjust hyperparameters in Kohya_ss and retrain.
- For concept bleeding or tagging issues: You need to modify your dataset. This could mean adding/removing tags, pruning bad images, or adding new images to clarify a concept.
Essential to Advanced Guide to training a LoRA
For more advanced problems like concept bleeding, the solution often lies in dataset balancing or more sophisticated tagging. Let's look at the advanced sections of the guide.
Skim through these advanced sections to see the kinds of solutions experts use: Multi-concepts and balancing datasets: Understand the problem of 'concept bleeding' where parts of one concept (e.g., an outfit) leak into the general character token (jinx). The solutions involve balancing the dataset with more repeats or using different trigger words. Using DAAM to troubleshoot tags: This introduces a tool (DAAM) that creates heatmaps to show exactly which part of an image a tag is influencing, providing a powerful way to debug tagging issues.
Test your understanding!
You've trained a LoRA for a character for 10 epochs. You generate an XYZ plot comparing all 10 checkpoints.
- You observe that epochs 1-4 are underfit (the face is inconsistent).
- Epochs 8-10 are clearly overfit (images are saturated, and the character is always in the same pose from your training data).
- Epoch 6 seems to be the best, but the character's signature red jacket sometimes appears bluish.
What is your diagnosis, and what are your next two steps?
Show answer
Diagnosis:
- The optimal training duration is around 6 epochs. The current training run is too long.
- The bluish jacket indicates a problem with concept learning, possibly due to a small dataset, incorrect tags, or concept bleeding from other elements in your images (e.g., a lot of blue backgrounds).
Next Steps:
- Immediate Action: Use the
epoch-000006.safetensorscheckpoint as your "best" model for now. - Iterate and Retrain: To fix the jacket color issue, investigate your dataset. Check the captions for the images with the red jacket. Are they consistently and accurately tagged with
red jacket? Are there other dominant blue elements that could be confusing the model? You could try strengthening thered jacketconcept by adding more images of it or increasing the repeats for that folder. Then, retrain the model, but this time, you only need to train for about 6-7 epochs, saving you time.
Conclusion
You have now closed the loop on the fine-tuning process. Evaluating your model is as important as training it, transforming you from someone who just runs a script to a practitioner who can diagnose problems and systematically improve their results.
Key Takeaways:
- Evaluation is a two-pronged approach: Use qualitative inspection (XYZ plots) to judge visual appeal and find the best epoch, and quantitative metrics (loss curves) to monitor training health.
- Identify and Avoid Overfitting: Your primary goal is to find the sweet spot between an underfit and overfit model. Saving multiple epochs and comparing them is the key.
- Evaluation Drives Iteration: Use your evaluation to diagnose problems with your training parameters (learning rate, steps) or your dataset (tags, image quality). Each training run should be an experiment informed by the last.
- Troubleshooting is Detective Work: Fixing issues often involves going back to your dataset and analyzing your captions and images to understand why the model is making certain mistakes.
Preview of the next lesson:
Now that we have mastered the full cycle of fine-tuning, training, and evaluation, we will turn our attention to a specific and important aspect of modern generative models: content safety. In the next lesson, we will understand content filtering in diffusion models and the methods used to bypass them, exploring the technical implementations of safety checkers and the techniques used in the community to navigate them, which aligns with your interest in generating uncensored content.