
Hello! Welcome to your next lesson in Medical Instrumentation.
In our last session, we distinguished between the different kinds of signals found in EEG data: the brain's ongoing background hum (spontaneous EEG), its specific reaction to discrete events (ERPs), and its rhythmic response to periodic stimuli (SSEPs).
This lesson builds directly on that foundation. We will now focus entirely on spontaneous EEG and learn how to unlock the information hidden within its complex squiggles. We'll be addressing the learning outcome: Apply spectral analysis (FFT) to identify EEG frequency bands (delta, theta, alpha, beta, gamma).
This is a cornerstone topic for both your university course and your work at Neuraease. Spectral analysis is the primary method for translating raw EEG into meaningful metrics. It allows us to quantify brain states like relaxation, alertness, or sleep, which is the first step toward building predictive models for cognitive and emotional changes.
From Time to Frequency: Decomposing the EEG Signal
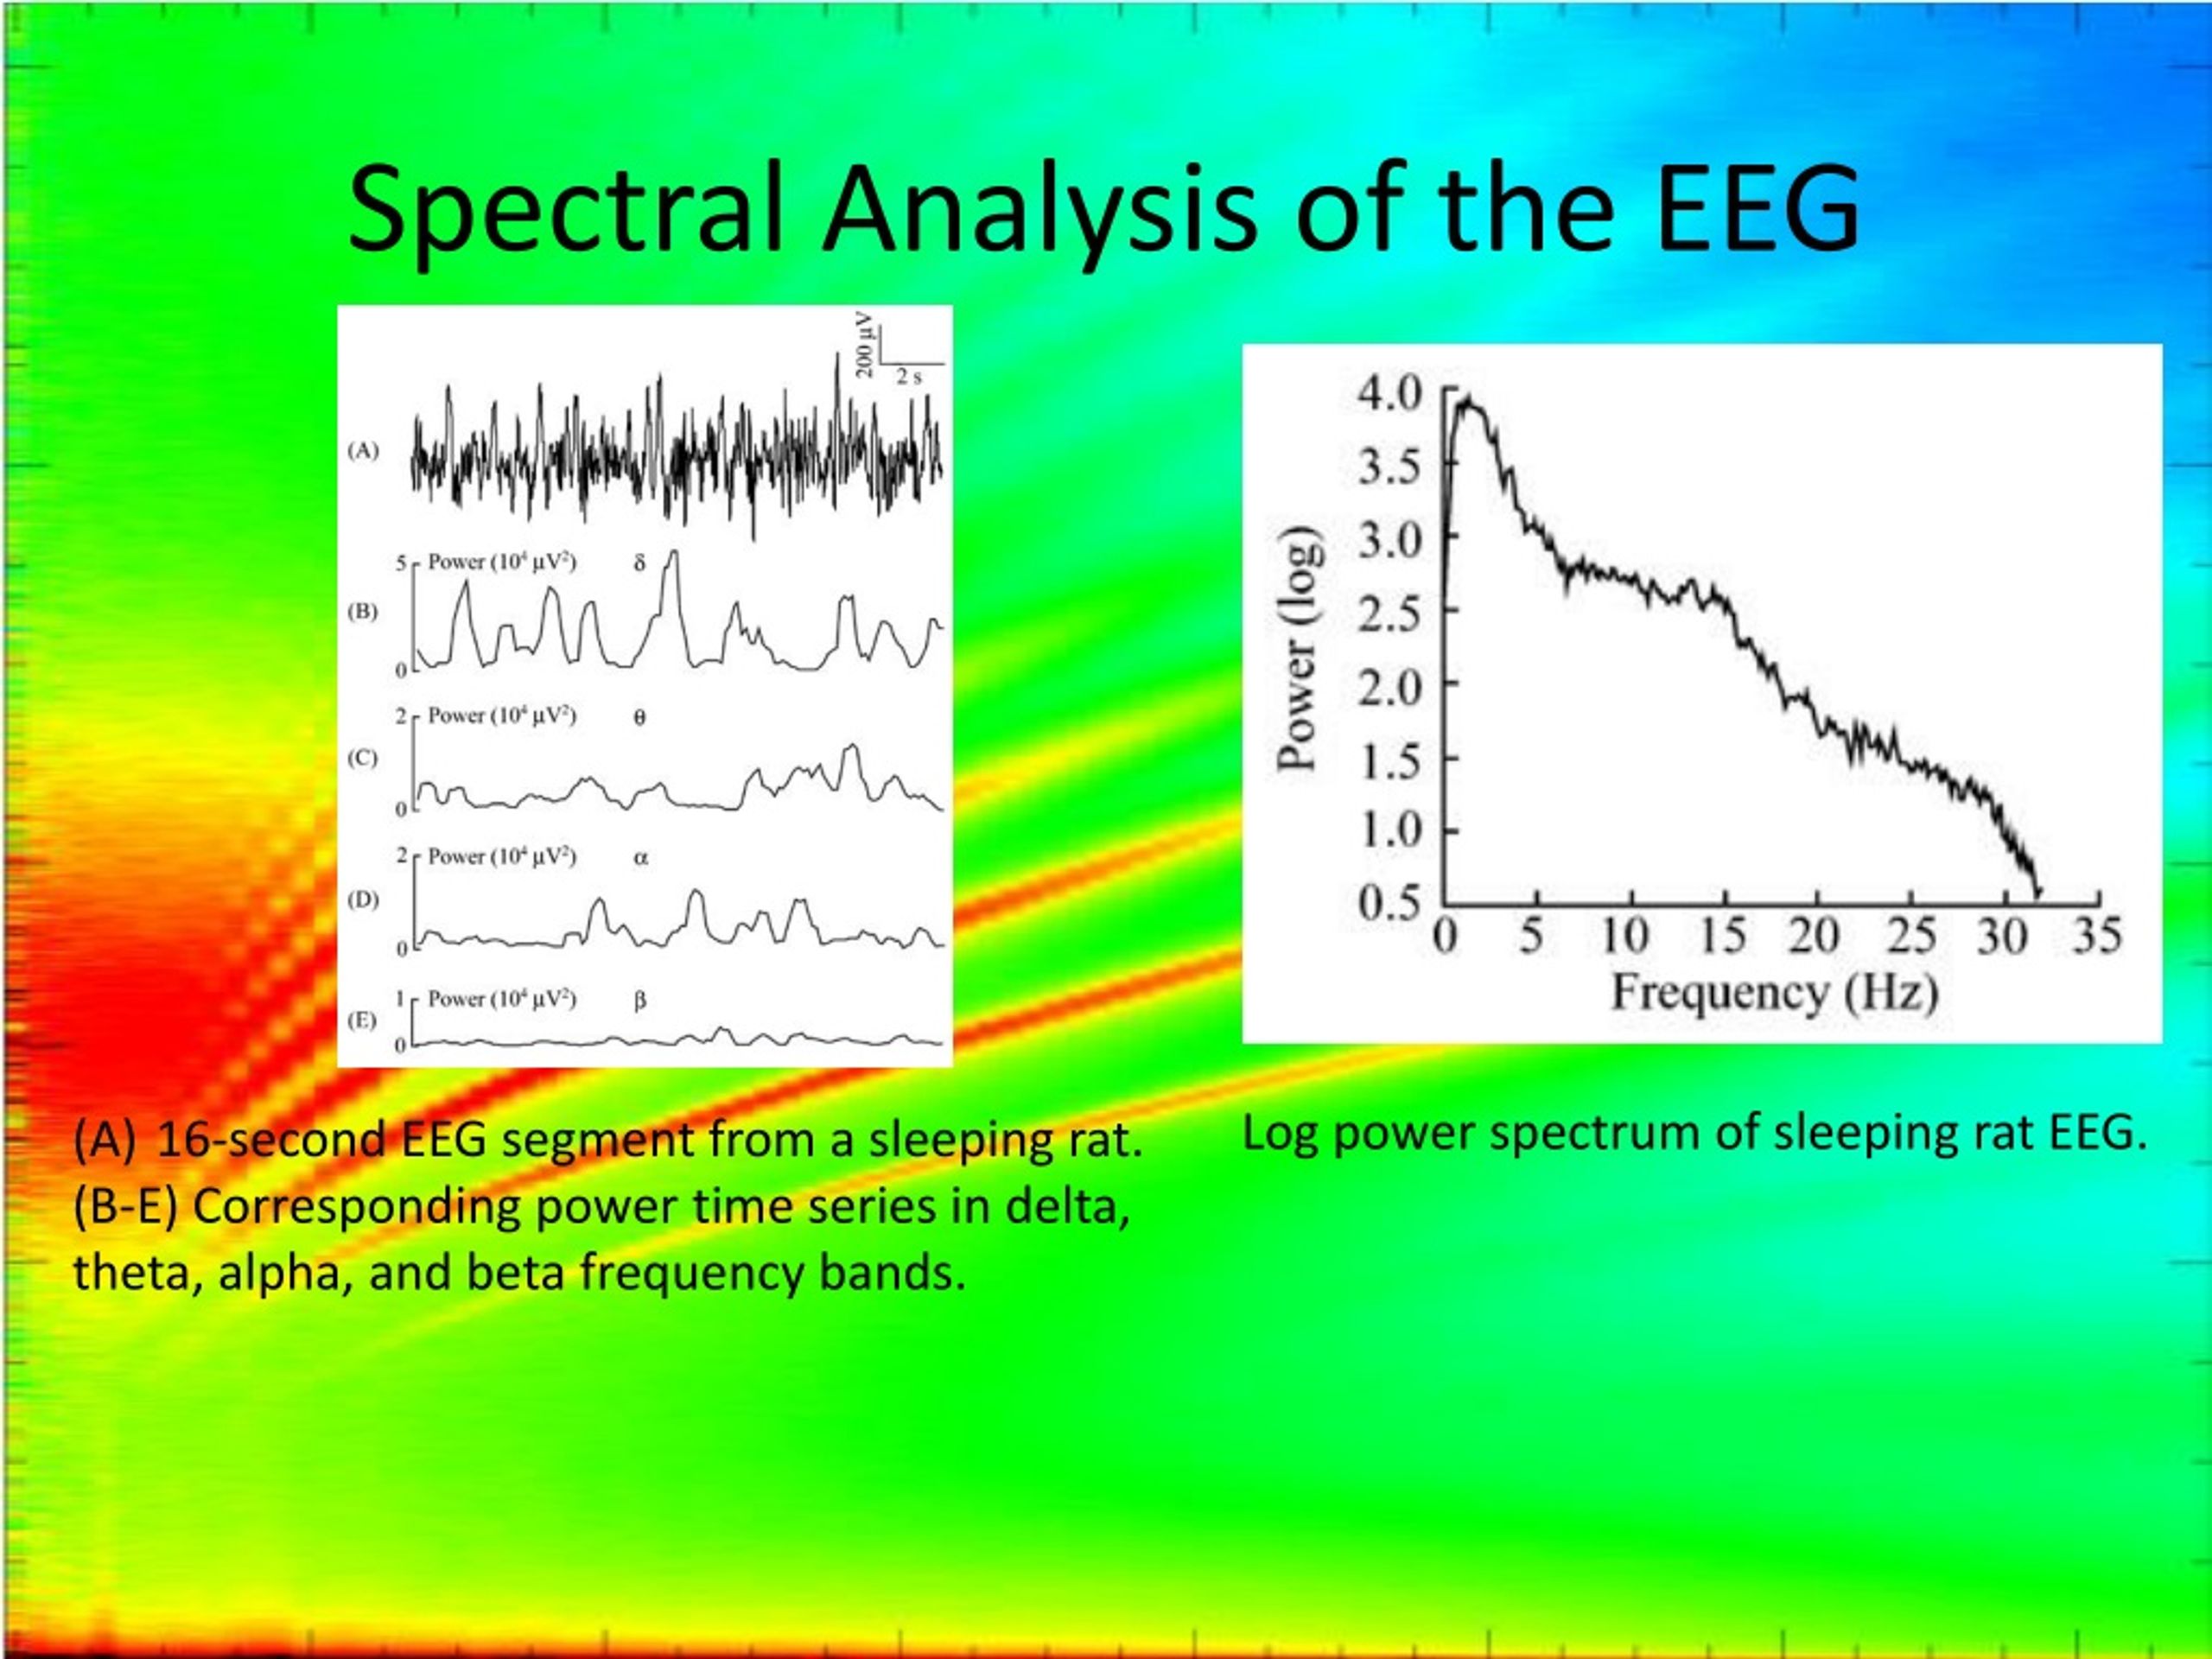
When we look at a raw EEG recording, we see voltage changing over time. This is the time domain. While useful, it's like listening to an entire orchestra at once—you hear the music, but it's hard to distinguish the individual instruments.
Spectral analysis is a technique that acts like a prism for signals. It takes the complex, mixed-up EEG signal and separates it into its fundamental components: simple sine waves of different frequencies. This gives us a frequency domain view, showing us how much "power" or "energy" is present at each frequency. For this, we use the Fast Fourier Transform (FFT), an efficient algorithm for computing this transformation.
Given your background in ECE, you'll recognize this as a direct application of the Fourier Transform you studied for general signal processing. The principle is identical; we're just applying it to the specific context of brain signals.
The image below shows this concept in action. A raw EEG signal is decomposed into its constituent frequency bands, and the power spectrum graph on the right shows the power contribution of each frequency.
The Rhythms of the Brain: EEG Frequency Bands
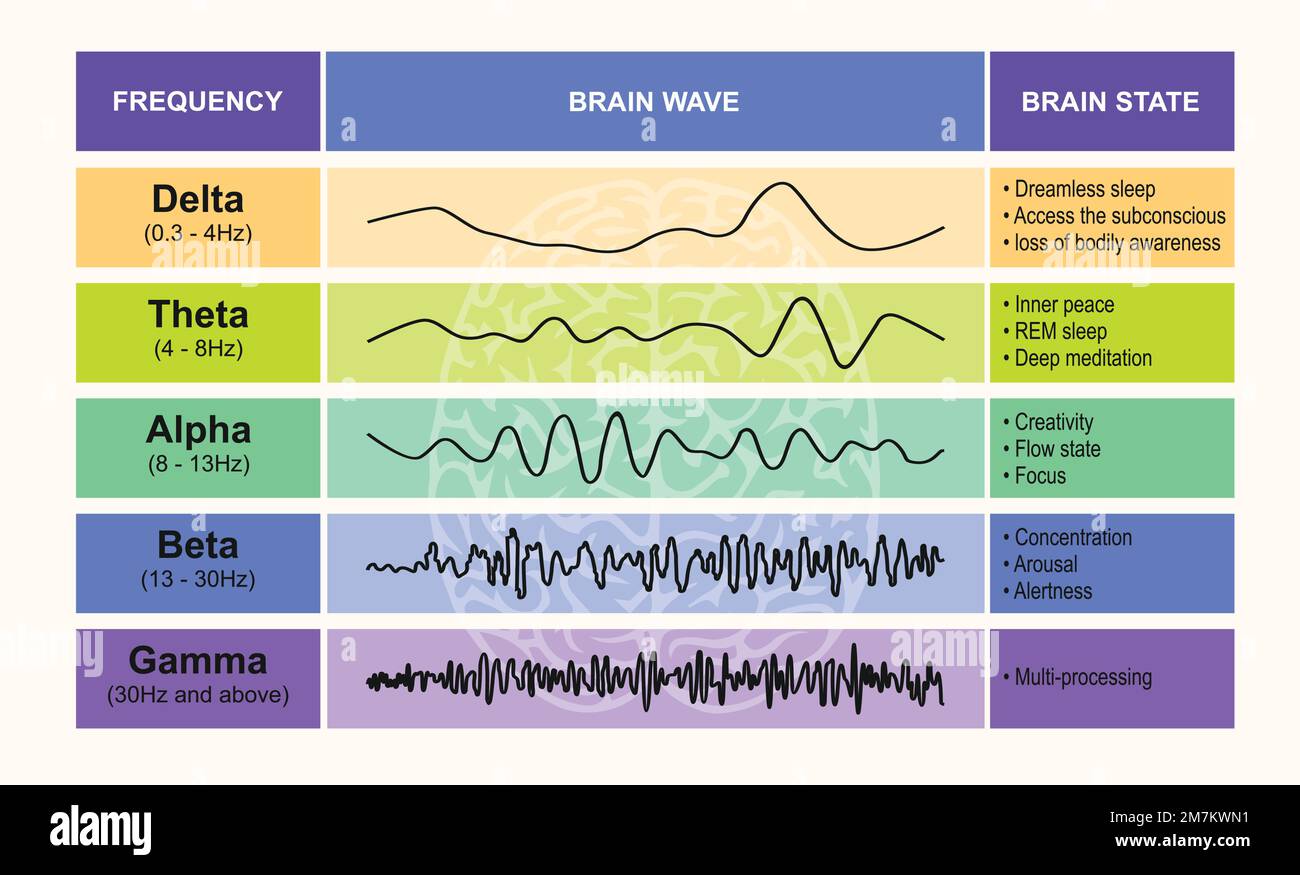
Neuroscientists have discovered that brain activity tends to group into several key frequency ranges, or "bands." Each band is associated with different brain states and cognitive functions.
Let's get familiar with their names and characteristics. The infographic below provides a great at-a-glance summary.
To solidify this, watch this brief, clear explanation of the bands and their functions.
EEG (Electroencephalogram) Explained
This video from the Zachary Cortex channel provides a very accessible explanation of the key frequency bands and the states they are typically associated with.
Watch the segment from 04:31 to 05:11. Focus on the names of the five key bands (Delta, Theta, Alpha, Beta, Gamma), their frequency ranges, and the associated mental states.
Here is a summary table for your notes, which includes the typical frequency ranges and associated states you'll need to know.
| Band Name | Frequency Range (Hz) | Associated Brain States & Functions |
|---|---|---|
| Delta (δ) | 0.5 – 4 Hz | Deep, dreamless sleep; healing and regeneration. Dominant in infants. |
| Theta (θ) | 4 – 8 Hz | Drowsiness, light sleep, deep meditation, memory consolidation. |
| Alpha (α) | 8 – 12 Hz | Awake but relaxed, calm, eyes closed. The "idling" rhythm of the visual cortex. |
| Beta (β) | 12 – 30 Hz | Actively thinking, focused, alert, problem-solving, normal waking consciousness. |
| Gamma (γ) | > 30 Hz | High-level information processing, "binding" of sensory information, peak focus. |
The "How-To": Practical Spectral Analysis with FFT
Now, let's look at the mechanics of applying the FFT to EEG data. This technical guide from Brain Products, a major EEG equipment manufacturer, will walk us through the essential concepts.
This resource dives into the practical details of applying the FFT to EEG data. Given your engineering background, the technical points on frequency resolution and signal properties will provide a solid foundation for understanding the process correctly.
Please review the following slides from the presentation: Slide 8: Note the table of 'EEG frequency bands' for another reference. Slides 10-12: Read the 'Why FFT?' and 'What is FFT?' sections. Focus on the core idea of decomposition and that the output gives us spectral amplitude or power. Slide 17: This is crucial. Pay close attention to how 'Frequency resolution' (Δf) is determined by the Sampling Rate (SR) and the number of data points (N) in your analysis window. Slide 21: Read the 'Interim Summary' for a concise recap of the key points.
Two key takeaways from that reading:
- EEG is non-stationary: Its statistical properties change over time. We can't just FFT an hour-long recording. Instead, we assume it's "quasi-stationary" and analyze it in short, overlapping windows.
- Frequency Resolution is a Trade-off: The resolution of your frequency spectrum (
Δf) is determined by the sampling rate (SR) and the length of the window you analyze (Npoints, orTseconds):
A longer window gives you finer frequency resolution (e.g., distinguishing 10 Hz from 10.1 Hz) but blurs changes over time. A shorter window gives you better temporal resolution but coarser frequency resolution.
Application: From Spectrum to Feature
Looking at a spectrum plot is informative, but for an application like Neuraease, you need a number—a feature you can use. This is where band power comes in. Band power is the total power contained within a specific frequency band. It's calculated by finding the area under the power spectrum curve for that band.
This tutorial provides a fantastic, practical guide to calculating band power in Python.
Compute the average bandpower of an EEG signal
This tutorial bridges the gap between theory and practice. It shows how to compute the average power within a frequency band—a process that creates a quantitative feature you could feed into a machine learning model.
Read through the tutorial, focusing on these sections: Foreword & Welch's Method: Understand why we use Welch's method (it averages spectra from smaller windows to reduce noise) and how window length affects the result. Average band power: See how to calculate absolute power (the total power in the band) and relative power (the band's power as a percentage of total power). Generalization: Look at the bandpower Python function. You don't need to be a Python expert; focus on the logic of its inputs (data, sampling rate, band) and its output (a single power value).
The concept of relative power is particularly important. A person's absolute EEG power can vary for many reasons (e.g., skull thickness). Normalizing by dividing a band's power by the total power makes the feature more robust and comparable across sessions and individuals.
Test your understanding!
You have a 10-second segment of EEG data sampled at 250 Hz. You want to analyze it using an FFT.
- What is the highest frequency you can resolve in your analysis? What is this limit called?
- If you perform an FFT on the entire 10-second segment (N = 2500 points), what is your frequency resolution (
Δf)? - You are particularly interested in the alpha band (8-12 Hz). To get a more stable power estimate, you decide to use Welch's method with 2-second windows. What is the new frequency resolution for each window's spectrum? How does this trade-off affect your analysis?
Show answer
- The highest frequency you can resolve is half the sampling rate, which is 250 Hz / 2 = 125 Hz. This is called the Nyquist frequency.
- The frequency resolution
ΔfisSR / N. Here,Δf= 250 Hz / 2500 points = 0.1 Hz. This means your spectrum will have a data point every 0.1 Hz. - With 2-second windows, the frequency resolution for each window is
Δf = 1 / T = 1 / 2s = 0.5 Hz. The trade-off is that you have gained spectral stability (a less noisy power estimate, which is the goal of Welch's method) at the cost of frequency resolution. You can no longer distinguish between 10.1 Hz and 10.2 Hz, as they both fall into the same 0.5 Hz bin, but your overall estimate of power between 8 and 12 Hz will be more reliable.
Conclusion
In this lesson, you've learned the fundamental technique of EEG analysis. You can now take a complex raw signal and, using spectral analysis, identify and quantify its core components.
Key Takeaways:
- Spectral analysis (using the FFT) transforms an EEG signal from the time domain (voltage vs. time) to the frequency domain (power vs. frequency).
- EEG activity is categorized into five main frequency bands: Delta (δ), Theta (θ), Alpha (α), Beta (β), and Gamma (γ).
- Each band is associated with distinct cognitive and physiological states.
- Band power (absolute or relative) is a key feature derived from the spectrum, quantifying the activity in a specific band. This is a critical input for machine learning models and quantitative analysis.
- There is a practical trade-off between temporal and frequency resolution when choosing your analysis window size.
Preview of the Next Lesson:
We've now identified the frequency bands. The next logical step is to explore what they mean in more detail. In our next lesson, we will focus on correlating specific EEG frequency band activity with cognitive and emotional states. This will directly link the features we just learned to extract with the real-world applications at the heart of your work with Neuraease, such as detecting changes in arousal, attention, and relaxation.
Can't find a good explanation? Sign up and we'll make it for you
Sign up