
Hello and welcome to the next stage of your n8n journey!
In the last lesson, you successfully configured user management for your self-hosted n8n instance, turning it into a secure, collaborative platform. With the setup phase complete, our focus now shifts to the operational aspects of running n8n in a production environment.
Today, we will tackle the crucial topic of troubleshooting. The learning outcome for this lesson is to monitor workflow execution history and logs for production issues. As a developer, you know that even the best code can fail. Understanding how to quickly identify, diagnose, and react to problems is essential for maintaining reliable automations. We will explore both the built-in n8n interface and the lower-level system logs that are particularly relevant for your self-hosted setup.
1. The First Line of Defense: The Executions UI
When a workflow doesn't behave as expected, your first destination should be the Executions view in the n8n UI. This is a high-level dashboard that provides a complete history of every time your workflows have run.
You can access the list of all executions for your instance or for a specific project. This view allows you to see the status of each run at a glance: Success, Failed, Running, or Waiting.
The official n8n documentation provides a concise overview of how to navigate and use the 'All Executions' view. Let's start there.
Read the sections 'All executions' and 'Filter executions'. Focus on how to access the execution list and the different criteria you can use to filter it, especially by 'Status'.
When troubleshooting, the most valuable filter is, of course, Status: Failed. This immediately narrows down the list to only the workflows that have encountered a problem.
Once you've identified a failed execution, you can click on it to open the workflow canvas in the state it was in when it failed. This is where you can perform your diagnosis.
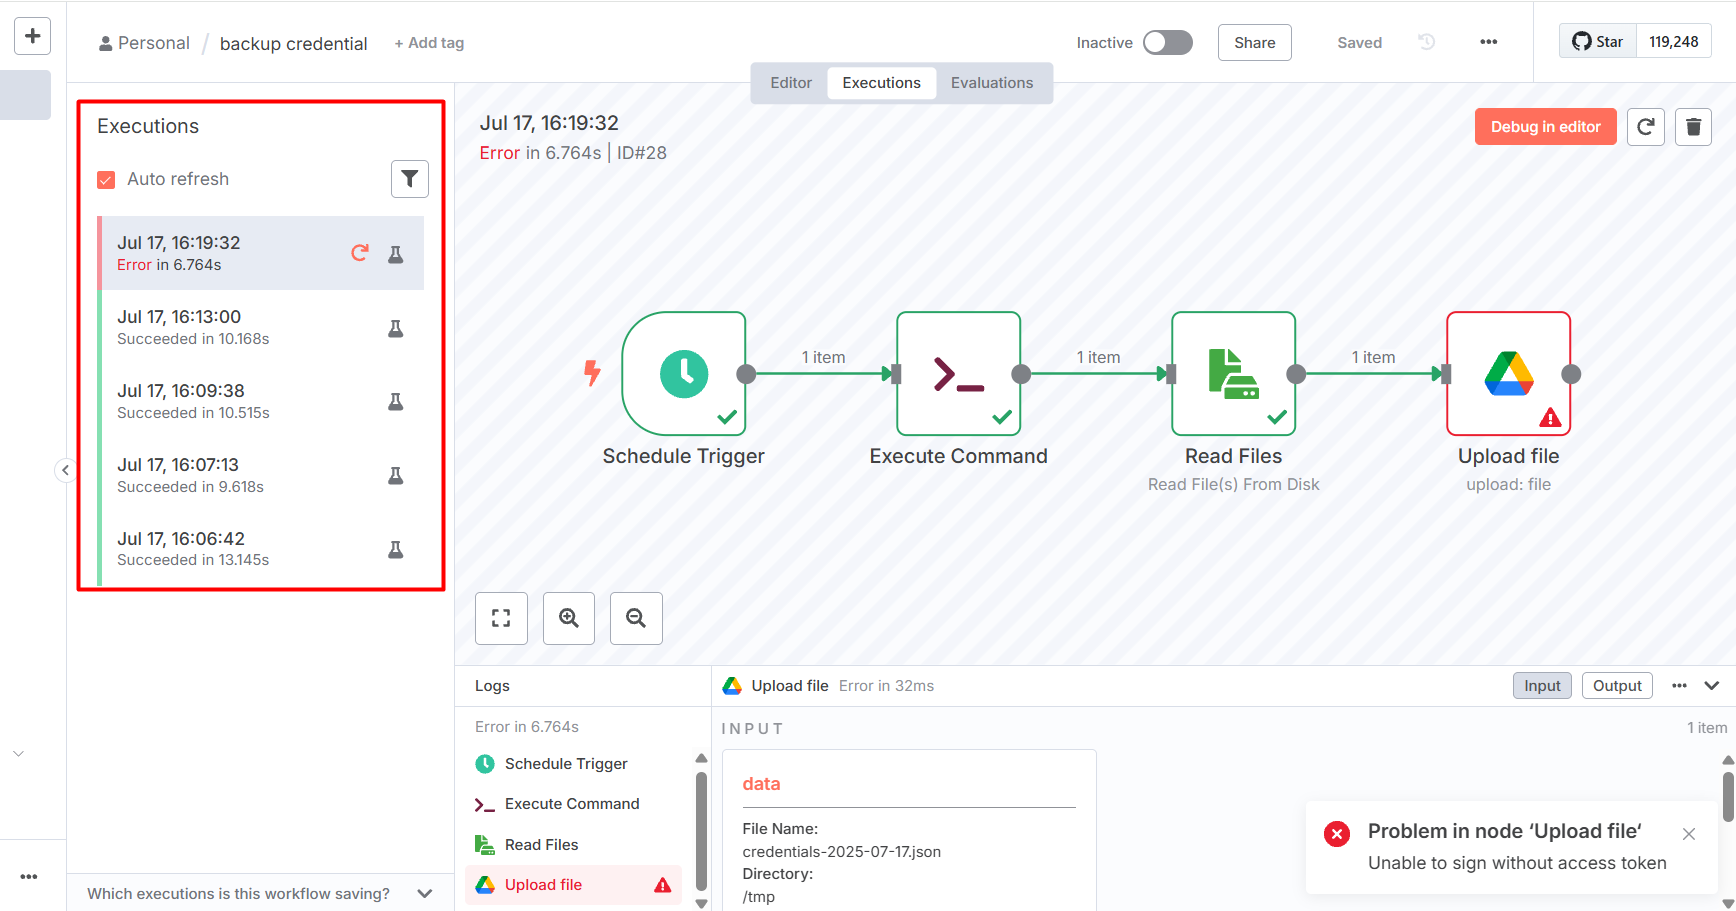
After diagnosing the issue and (potentially) fixing the workflow, you don't always have to wait for the trigger to fire again. For many failed executions, you can attempt a retry.
The same documentation page explains how to retry a failed workflow.
Read the short section 'Retry failed workflows'. Note the difference between retrying with the currently saved workflow versus the original workflow.
This UI-based approach is excellent for monitoring and fixing issues related to workflow logic and data.
2. Going Deeper: System-Level Logs
As someone with a software development background, you're well-acquainted with application logs. For a self-hosted n8n instance, these logs are an invaluable resource for debugging deeper, system-level issues that might not even appear as a failed execution (e.g., problems with the database connection, server startup, or internal n8n services).
n8n's logging is highly configurable through environment variables in your docker-compose.yml or .env file.
The n8n documentation on logging explains the key environment variables you can use to control log behavior.
Review the table under the 'Setup' section and the description of 'Log levels'. Pay close attention to N8N_LOG_LEVEL and N8N_LOG_OUTPUT. You don't need to change your configuration now, but you should know these options exist.
Here's a quick summary of the most important settings for your Docker-based setup:
N8N_LOG_LEVEL: Controls the verbosity.infois the default. For deep debugging, you might temporarily set it todebug, but be aware this is very verbose.erroris useful for seeing only critical problems.N8N_LOG_OUTPUT: Determines where logs are sent. The default,console, is perfect for Docker, as it allows you to view logs using standard Docker commands. You can also set it tofileto write logs to a persistent volume.
To view the console logs for your running n8n instance, you can use the following Docker command from your terminal, in the same directory as your docker-compose.yml file:
docker compose logs -f n8n
The -f flag "follows" the log output, streaming new log entries to your terminal in real-time. This is the equivalent of tail -f for Docker containers and is a powerful way to see exactly what the n8n service is doing.
3. Proactive Monitoring: Building an Error-Handling Workflow
Reacting to failures is good, but proactively capturing and routing them is better. The most robust way to handle production errors in n8n is to build a dedicated error-handling workflow. This is a special workflow that is automatically triggered whenever another workflow fails.
This approach lets you use the power of n8n itself to:
- Log structured error data to a database or spreadsheet.
- Send detailed notifications to Slack, Discord, or email.
- Even attempt automated recovery actions.
Two key nodes enable this pattern: the Error Trigger and the Stop and Error node.
Why 97% of n8n Workflows Fail in Production (And How to Fix It)
This video by Bart Slodyczka provides a great introduction to the native error handling nodes and the concept of a dedicated error workflow.
Watch this segment (11:08 - 15:59) to understand how to set up an 'Error Trigger', link it to a main workflow, and use the 'Stop and Error' node to deliberately send custom error messages. The demonstration of logging the error details to a Google Sheet is a perfect example of this pattern.
Now that you understand the core components, let's look at a comprehensive, step-by-step guide to building a versatile error-handling system.
One n8n Workflow for Unlimited Error Handling (Step-by-Step)
This video from Nate Herk builds on the same concept and creates a complete error logging and notification system. It also highlights a critical nuance about what constitutes a true 'error'.
Watch from 00:45 to 08:02. Pay close attention to how the error data is extracted and mapped to both a Google Sheet and a Slack message. The section starting at 06:56 is particularly important—it explains the difference between a workflow that truly fails (and triggers the error workflow) versus one that completes but has a logical error.
This distinction is vital for production reliability. An error workflow will only catch "red" failures where a node throws an unhandled exception. It will not catch "green" failures, where the workflow finishes successfully but, due to faulty logic, produces an incorrect result (e.g., an API call that returns a valid but empty dataset). Handling those "green" failures requires building explicit checks and logic paths within the workflow itself (e.g., using an If node to check if data was found).
Test your understanding!
You have a primary workflow that fetches customer data from an API and then writes it to a PostgreSQL database. You've set up a separate error-handling workflow (triggered by the Error Trigger) to send you a Slack notification upon failure.
Which of the following scenarios would trigger the error-handling workflow?
- The API is down, and the
HTTP Requestnode times out. - The database credentials in n8n are incorrect, and the
Postgresnode fails to connect. - The API call is successful, but it returns an empty array of customers. The workflow proceeds and finishes successfully without writing anything to the database.
- You use an expression in a
Setnode to access{{ $json.customer.id }}, but the API returned the ID as{{ $json.customer.customerId }}.
Show answer
The error-handling workflow would be triggered by scenarios 1, 2, and 4.
- API Timeout: This is a hard failure in the
HTTP Requestnode, which will cause the execution to fail and trigger the error workflow. - Incorrect DB Credentials: This is a connection failure in the
Postgresnode, which will also cause the execution to fail. - Empty API Response: This is a "green" failure. The workflow executes all steps successfully from n8n's perspective, even though the logical outcome is wrong. This would not trigger the error workflow. You would need to add an
Ifnode to handle this case explicitly within the main workflow. - Incorrect Expression: Accessing a non-existent property with dot notation will throw a
Cannot read properties of undefinederror, causing the execution to fail and triggering the error workflow.
Conclusion
In this lesson, you've learned the essential techniques for monitoring your n8n workflows, moving from reactive checks to a proactive, automated system. This is a fundamental skill for maintaining the reliability and health of your automations as you move them into production.
Key Takeaways:
- The Executions UI is your primary tool for a quick overview of workflow health, allowing you to filter for failures, inspect error messages, and retry failed runs.
- For your self-hosted instance, system-level logs (viewed via
docker compose logs) provide deep insight into the n8n service itself, which is crucial for debugging infrastructure-related problems. - The most robust monitoring strategy involves creating a dedicated error-handling workflow using the
Error Triggerto automatically capture failures, log structured data, and send real-time notifications. - It's critical to distinguish between "red" failures (which trigger an error workflow) and "green" failures (which require explicit logical checks within the workflow).
Preview of the Next Lesson:
Now that you know how to monitor and diagnose issues in your workflows, the next logical step is to ensure you can recover from a catastrophic failure. In the next lesson, we will cover how to implement a strategy for backing up and restoring n8n data, protecting your valuable workflows, credentials, and execution history.