
Hello. In the previous lesson, you separated the stages of the FlyWire pipeline: a trained model produces segmentation evidence; agglomeration creates editable segments; proofreading changes the reconstruction graph; and materialization produces versioned connectivity tables. That distinction matters here because an apparent error in the interface is not simply “the AI was wrong.” It is a specific failure to infer cellular continuity from imperfect, crowded image evidence.
This lesson develops a practical diagnostic habit: use the 3D reconstruction to find suspicious regions, then use the 2D EM stack to decide whether the suspicion is supported. By the end, you should be able to explain why ambiguous EM regions tend to produce either false splits or false merges, and distinguish a well-supported diagnosis from an unresolved case.
The central idea: the segmentation overlay is a hypothesis
In FlyWire, the grayscale EM image is the underlying evidence; the colored segmentation overlay is a model-generated interpretation of that evidence. The 3D mesh is a useful rendering of that interpretation. Neither is ground truth by itself.
A useful engineering mindset is to treat a selected segment as a hypothesis with two possible failure modes:
| Reconstruction state | Biological reality | Error type |
|---|---|---|
| One neurite is represented as separate pieces | The pieces belong to one continuous cell process | False split |
| One reconstructed object contains material from separate neurites | The processes belong to different cells | False merge |
A false split is usually a missing connection. In the 3D view it may look like a branch that ends too abruptly, an isolated piece nearby, or a conspicuous gap in an arbor.
A false merge is an extra connection. In 3D it may look like a branch that crosses into an incompatible region, a sudden change of branching direction, an implausible dense patch, or two otherwise separate structures linked by a narrow bridge.
These are useful warning signs, not verdicts. Drosophila neurites can run alongside one another, cross, self-fasciculate, and make sharp-looking changes in ways that can appear suspicious. In other words, “odd-looking” is a reason to inspect the EM stack, not a reason to edit.
The FlyWire interface keeps this evidence and hypothesis visible together:
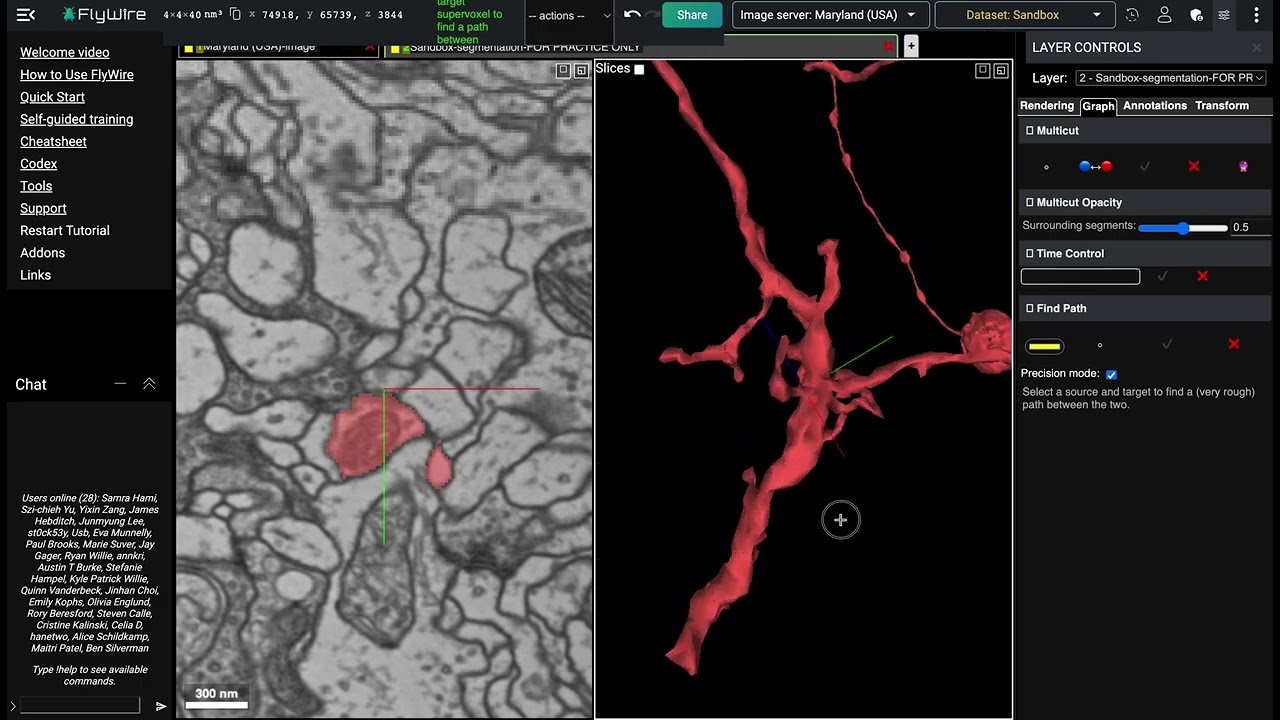
For this lesson, do not focus on the editing controls. Focus on the two questions behind every candidate problem:
- Does the same cellular material continue through adjacent sections?
- Does the current segmentation assignment preserve or contradict that continuity?
Why EM evidence becomes ambiguous
An EM volume is assembled from many very thin image sections. A neurite is three-dimensional, but you inspect it through a stack of two-dimensional views. This introduces ambiguity even before any neural-network prediction or agglomeration decision occurs.
The primary FlyWire paper describes the diagnostic evidence used by experienced proofreaders: overall 3D morphology first, then close review of the 2D stack, including membranes, microtubules, endoplasmic reticulum, vesicles, and other intracellular features.
FlyWire: Online community for whole-brain connectomics - PMC
Read the “Proofreading neurons in FlyWire” discussion in the FlyWire Nature Methods paper. It explains why morphology is a screening tool and how EM features resolve difficult boundaries and continuations.
In the “Proofreading neurons in FlyWire” section, begin at “Proofreading relied first on the 3D morphology of the neurites” and read the diagnostic account. Focus on the difference between suspicious 3D patterns and confirming image-level evidence: membrane visibility, intracellular landmarks, and changes in microtubule direction.
Four recurring sources of ambiguity are especially important.
1. A boundary is poorly visible
A cell membrane is the key evidence that two adjacent image regions belong to different cells. Yet a membrane may be faint, damaged, partially obscured, or oriented unfavorably relative to the sectioning direction. In such regions, a model may not confidently detect a boundary.
That weak boundary can cause either error:
- If the system treats a continuous neurite as separated by a boundary, it may terminate the reconstruction early: a false split.
- If the system fails to see the boundary between neighboring neurites, it may join them: a false merge.
The same image ambiguity can therefore support opposite model mistakes. The outcome depends on the local prediction pattern and on how the subsequent agglomeration procedure groups supervoxels.
2. Two processes travel close together
Neurites often run in parallel, cross in projection, or form dense bundles. In one section, two nearby processes may look like a single connected shape; in the next, their separation may be more obvious.
This is why one slice is rarely enough. A real continuation should remain coherent as you move through neighboring sections. A superficial contact may appear to connect in one or a few slices but fail to preserve a consistent path across the stack.
The same issue appears in 3D as several recognizable false-merge geometries:
- X-shaped merge: two branches cross and are incorrectly joined at the crossing.
- H-shaped or parallel merge: two long, parallel branches are connected by one or more bridges.
- Twig-to-twig merge: fine terminal branches from distinct cells are linked in a dense arbor.
The H-shaped case deserves particular caution: what looks like a bridge in a 3D mesh may be a connection located elsewhere along the branches. The 3D rendering identifies the architectural anomaly; the stack locates the actual image-level bridge.
3. The data itself has a discontinuity
Automated segmentation assumes that adjacent sections have been correctly aligned. But an individual image section can be shifted, poorly imaged, missing, or degraded. From the model’s perspective, the cell can appear to jump position between slices.
A registration problem can produce two different errors:
- The model may stop at the discontinuity, giving a false split.
- It may connect the process to the wrong nearby continuation after the apparent jump, giving a false merge, often called a path swap.
The most important clue is that the anomaly affects more than the selected neuron. Nearby structures may exhibit the same apparent displacement. A distinctive organelle, large process, or other local landmark can help establish how the imagery shifted from one section to the next.
4. The process is extremely thin or biologically complex
Thin neurites can be pinched between surrounding structures, visually fade into a crowded region, or disappear into a difficult imaging area. The segmentation may end because it cannot follow a reliable interior region.
Likewise, at a synapse, one cell can wrap around part of its synaptic partner. The cellular boundary may become blurry precisely where the two cells are biologically close. Such sites are plausible false-merge locations, but the biological interaction itself does not prove that a merger occurred.
This distinction is essential: a dense or unusual structure is not automatically an error. It is a location where the available image evidence is less decisive.
Evidence for continuation: follow more than the outline
When an outer membrane is unclear, the proofreader should not rely only on the silhouette of a neurite. Internal features can provide continuity evidence across sections.
The most informative features described in the FlyWire paper include:
- Microtubules: elongated intracellular structures whose orientation can persist along a neurite.
- Endoplasmic reticulum tubules: internal structures that can sometimes be tracked through an ambiguous boundary.
- Cytosol appearance: a neurite’s interior may have a characteristic darkness or texture relative to nearby processes.
- Vesicle clouds and organelles: their presence, size, and arrangement may help distinguish one process from another.
Suppose a selected branch appears to stop at an unclear boundary. A nearby segment on the other side is a credible false-split candidate when several observations agree:
- Its spatial position matches the expected continuation.
- Its diameter changes plausibly rather than abruptly becoming a very different process.
- An internal feature, such as a microtubule bundle or ER tubule, can be followed across the uncertain region.
- The continuation remains consistent for multiple neighboring slices.
- Adding it would make the 3D morphology more coherent rather than creating a strange detour.
By contrast, a sudden reversal in the apparent flow of microtubules, an abrupt change in internal texture, or a candidate that only works in one slice argues against continuation. Those signs can indicate that the selected segment has crossed into a neighboring cell, making a false merge more plausible.
A good diagnosis therefore rests on converging evidence, not on a single visual cue. This is analogous to debugging state inferred from noisy inputs: a plausible rendered state is useful, but consistency across the underlying observations is what earns confidence.
A two-pass diagnostic workflow
Use a deliberate two-pass method whenever you inspect a suspicious region. It separates finding candidates from deciding what they are.
Pass 1: screen the 3D morphology
View the selected reconstruction at a scale large enough to understand the arbor’s overall architecture. Look for anomalies such as:
- abruptly truncated large branches;
- a sizable empty gap where a branch pattern appears incomplete;
- a long branch that suddenly reverses direction;
- a very thin neck joining two much larger, separate-looking structures;
- unusually broad, flat, porous, or unnaturally smooth extensions;
- dense or sparse local patches that do not match the rest of the arbor;
- multiple cell-body-like regions within one selected object.
At this stage, record the location of the anomaly. Do not infer its cause merely from the mesh. A dense tangle may be normal; a branch that looks truncated may leave the visible region or become too fine to recognize.
Pass 2: test the hypothesis in the 2D stack
At the suspect coordinate, inspect the selected overlay against the raw EM image and move through neighboring sections. Your goal differs by hypothesis.
| Hypothesis | What to seek in the EM stack | What would weaken it |
|---|---|---|
| False split | A nearby disconnected region that preserves position, caliber, membrane enclosure, and internal-feature continuity | A clear separating membrane, incompatible internal texture, or no stable candidate continuation |
| False merge | A narrow erroneous bridge, a missing membrane between selected regions, or incompatible intracellular organization on either side of the bridge | A continuous membrane-bounded process with coherent internal features through the region |
| Image misalignment | A coordinated shift or degradation affecting nearby landmarks, not only the selected cell | Stable surrounding landmarks and a discontinuity isolated to the selected process |
| Uncertain case | Conflicting, incomplete, or irrecoverably obscured evidence | Strong agreement among image continuity, morphology, and neighboring landmarks |
An uncertainty classification is a valid technical conclusion. If the membrane is unreadable through several sections and no internal structure can be tracked reliably, labeling it “likely false split” is more honest than asserting a repair. In later proofreading work, that distinction will determine whether you edit, seek review, or leave the reconstruction unchanged.
Common ambiguity patterns in FlyWire
The FlyWire proofreading guide provides practical examples of the patterns that lead to merger and split candidates.
Read the FlyWire Blog guide selectively for concrete failure patterns. It complements the primary paper with operational vocabulary for parallel mergers, image misalignment, synaptic ambiguity, missing thin processes, and path swaps.
Under “H-Shaped or Parallel Mergers,” read the parallel-branch example; note why the apparent 3D bridge may not be the real connection point. Under “Misalignments,” read the description of bad spots and the five-step landmark-based alignment check that follows it. Then read the “Synaptic Invagination” paragraph, beginning “Mergers can often occur at the synapse point,” through the boundary ambiguity. Finally, in “MIA Connections” and “Identifying Path Swaps,” read the missing-thin-neurite case and the path-swap description. Treat these as diagnostic patterns, not automatic rules for editing.
Here is how to reason through three representative cases.
Case A: a branch ends at a damaged or shifted section
In 3D, a backbone stops abruptly and a similarly sized orphan segment appears beyond the endpoint. In the 2D stack, the last clearly visible section before the endpoint and the first clear section after it appear displaced relative to nearby landmarks.
This is a false-split hypothesis caused by image misalignment. It becomes stronger if a distinctive nearby object shifts by the same amount and the candidate branch resumes with compatible cytosol and internal structure. It remains uncertain if several similarly shaped neighboring processes could plausibly be the continuation.
The key lesson is that the gap belongs first to the image coordinate relationship, not necessarily to the neuron.
Case B: two parallel backbones have an apparent cross-bridge
In 3D, the selected object resembles an H: two long branches run in parallel and appear connected across a short bridge. It is tempting to cut at the visually obvious bridge.
Instead, use the 2D stack to determine whether the two backbones are separate membrane-bounded neurites. Follow the apparent bridge across sections. The actual incorrect connection may occur at another location, and a “phantom” bridge may be only a rendering effect produced by geometry elsewhere in the graph.
This is a false-merge hypothesis when the two branches retain distinct cellular interiors and the selected segmentation crosses a boundary that should remain separate.
Case C: a thin process disappears into a crowded neuropil
A fine neurite or soma tract is visible beside a larger backbone, then disappears among neighboring processes. Across several slices, its membrane and interior are too faint to trace. A plausible segment exists on the other side, but multiple parallel structures create alternatives.
This may be a false split, but it is not yet a well-supported one. Thin-process continuity often has weaker evidence than backbone continuity. Use parallel neighboring neurons and local landmarks to constrain the search, but retain the possibility that the apparent target is a different process.
The diagnostic conclusion can be: possible false split; candidate continuation exists; evidence insufficient because the process is obscured in a dense region. That is far more useful than silently converting uncertainty into a merge.
A compact diagnostic note
For the next hands-on lessons, use a short note format whenever you find a candidate error. It forces you to separate observation from interpretation.
| Field | Example content |
|---|---|
| Location | Coordinate or shared-view link; branch context such as “distal dorsal backbone” |
| Initial 3D signal | “Abrupt terminal with nearby orphan segment” or “parallel branches connected by narrow bridge” |
| 2D stack evidence | “Membrane unclear across shifted section; nearby landmark displaced similarly” |
| Internal continuity | “Microtubule direction and cytosol appearance consistent” or “incompatible on either side” |
| Diagnosis | Likely false split, likely false merge, or uncertain |
| Confidence and next step | “Moderate; inspect more sections and verify in 3D before any edit” |
Notice that “likely” belongs to the interpretation, whereas a statement such as “clear membrane separates the two interiors on adjacent sections” belongs to the evidence. Keeping those separate makes later review much easier.
Key takeaways
Image ambiguity creates segmentation errors because the system must infer 3D cellular identity from noisy, crowded, sectioned EM imagery.
- False splits commonly arise when a true continuation becomes hard to follow: faint boundaries, thin neurites, missing or misaligned sections, and dense surrounding structures.
- False merges commonly arise when distinct neurites look connected: crossings, parallel runs, twig contacts, blurred synaptic boundaries, and path swaps after image artifacts.
- Use the 3D morphology to locate anomalies, but use the 2D EM stack to test them.
- Membranes matter, but intracellular continuity through microtubules, ER, cytosol appearance, and organelles can be decisive when boundaries are unclear.
- A suspicious shape is not proof. “Uncertain” is an appropriate diagnosis when the image evidence does not support a reliable conclusion.
Next, you will shift from diagnosis to data preparation: turning a small pre-labeled EM dataset into training and held-out arrays for a lightweight segmentation experiment. That proxy project will let you observe, quantitatively, why the same difficult visual regions tend to concentrate segmentation errors.
Can't find a good explanation? Sign up and we'll make it for you
Sign up