
Hello! Welcome back to our course on Mechanical Engineering fundamentals.
In our last lesson, we introduced the concepts of normal stress () as the internal force per unit area and normal strain () as the relative change in length. We treated them as separate quantities. However, the real power in mechanics of materials comes from understanding how they are connected. For any material, applying a stress causes a corresponding strain, and this relationship is unique to that material.
Today's lesson is all about exploring this crucial link. Our learning outcome is to interpret material properties from stress-strain curves and apply Hooke's Law. By the end of this lesson, you will be able to look at a simple graph and deduce a material's stiffness, strength, and ductility—essential properties for any engineering design, especially in aerospace where material selection is critical.
1. The Material's Fingerprint: The Stress-Strain Diagram
The relationship between stress and strain is determined experimentally using a tensile test. In this test, a standardized sample of a material, often shaped like a "dog bone," is pulled apart by a machine that records the applied force () and the resulting elongation (). These measurements are then converted into stress () and strain (). Plotting stress on the y-axis against strain on the x-axis gives us the stress-strain diagram.
To see how this works, let's watch a segment of a video.
Mechanics of Materials: Lesson 9 - Stress Strain Diagram, Guaranteed for Exam 1!
This video from Jeff Hanson explains how a stress-strain diagram is generated in a lab. It also introduces an important distinction between the simplified 'engineering stress' we typically use and the more complex 'true stress'.
Watch from 02:38 to 06:17. Focus on understanding the tensile test procedure and why we, as engineers, often use the 'engineering stress' curve which assumes the cross-sectional area A remains constant.
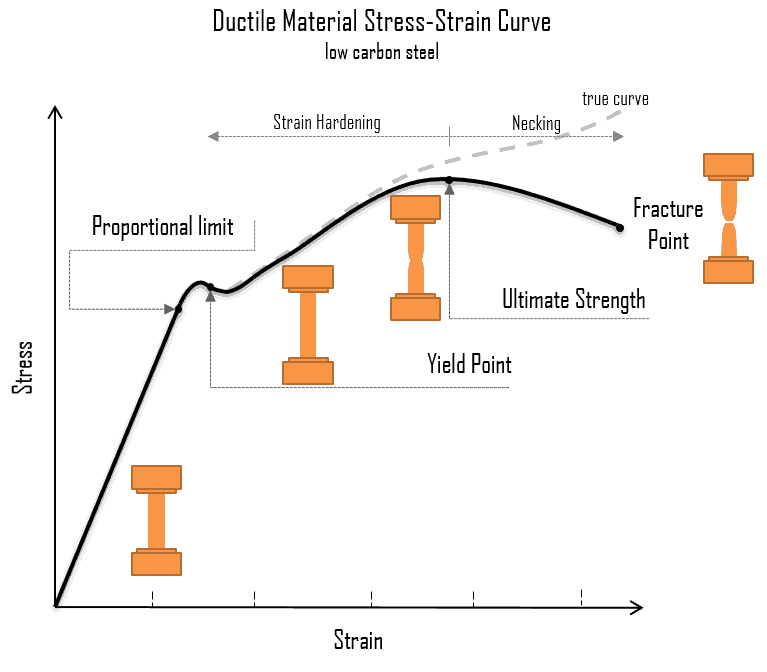
This diagram is effectively a mechanical "fingerprint" for a material. The image below shows a typical stress-strain curve for a ductile material like low-carbon steel, linking the points on the graph to the physical changes in the test specimen.
2. Deconstructing the Curve: Elastic Behavior and Hooke's Law
The most important region for many engineering designs is the initial, linear portion of the curve. This is the elastic region.
Mechanics of Materials: Lesson 9 - Stress Strain Diagram, Guaranteed for Exam 1!
Let's return to the video to explore the elastic region, the yield point, and the fundamental law that governs elastic behavior.
Watch from 06:17 to 12:38. Pay close attention to the definition of the elastic region, the concept of the material 'springing back', and how the slope of this region defines a critical material property.
As the video explained, if a material is loaded only within its elastic region, it will return to its original, undeformed shape once the load is removed. Within the initial, straight-line portion of this region (up to the proportional limit), stress is directly proportional to strain. This relationship is known as Hooke's Law.
Given your electronics background, you can think of Hooke's Law as the mechanical equivalent of Ohm's Law (). While Ohm's Law relates voltage, current, and resistance, Hooke's Law relates stress, strain, and a material's stiffness.
The formula for Hooke's Law is:
Where:
- is the normal stress.
- is the normal strain.
- is the Modulus of Elasticity, also known as Young's Modulus.
The Modulus of Elasticity, , is the slope of the stress-strain curve in the linear elastic region. It is a fundamental material property that measures its stiffness. A material with a high (like steel, GPa) is very stiff and deforms little under load, while a material with a low (like plastic or rubber) is flexible.

3. Beyond the Elastic Limit: Plastic Deformation
What happens if we stretch the material further?
- Yield Point (): Once the stress exceeds the elastic limit, the material enters the plastic region. The point where this transition occurs is the yield point, and the corresponding stress is the yield strength (). Beyond this point, the material will be permanently deformed. For most engineering designs, yield strength is considered the maximum allowable stress to prevent permanent damage.
- Strain Hardening: After yielding, many ductile materials require an increasing amount of stress to continue deforming. This phenomenon is called strain hardening.
- Ultimate Tensile Strength (UTS, ): This is the peak of the curve and represents the maximum stress the material can withstand before it starts to "neck down" and weaken.
- Necking & Fracture: After the UTS, the cross-sectional area of the specimen begins to decrease in a localized region (necking). Since engineering stress is calculated with the original area, the curve appears to slope down, even though the true stress is still increasing. Eventually, the material fractures at the fracture point.
For some materials, like many aluminum alloys common in aerospace, there isn't a distinct yield point. In these cases, we use a convention called the 0.2% offset method to define an approximate yield strength.
Understanding Material Strength, Ductility and Toughness
This short clip from The Efficient Engineer provides a clear, animated explanation of the 0.2% offset method.
Watch the segment from 01:28 to 01:54 to see how yield strength is determined for materials without a sharp yield point.
4. Key Material Properties from the Curve
The overall shape of the stress-strain curve tells us a great deal about a material's character.
Ductility and Brittleness
Ductility is a measure of a material's ability to undergo significant plastic deformation before fracturing. Materials like steel and aluminum are ductile; they will stretch and deform noticeably before breaking. This is a desirable property in many applications (like aircraft fuselages) because it provides a visible warning of impending failure.
Brittleness is the opposite. Brittle materials, like cast iron, glass, and ceramics, show little to no plastic deformation. They fracture suddenly without warning once the stress exceeds their strength.
Understanding Material Strength, Ductility and Toughness
Let's watch another clip from The Efficient Engineer that contrasts the stress-strain curves for ductile and brittle materials.
Watch from 03:14 to 04:10. Notice the dramatic difference in the strain at fracture between ductile and brittle materials.
Resilience and Toughness
The area under the stress-strain curve represents energy absorbed per unit volume.
- Modulus of Resilience: This is the area under the elastic portion of the curve. It represents the energy a material can absorb without any permanent damage. A material with high resilience is good for making springs.
- Modulus of Toughness: This is the total area under the entire curve up to fracture. It represents the total energy a material can absorb before breaking. Toughness is critical for components that might be subjected to overloads or impacts, like landing gear.
Mechanics of Materials: Lesson 9 - Stress Strain Diagram, Guaranteed for Exam 1!
This final video segment clearly explains the practical difference between resilience and toughness, using excellent real-world examples.
Watch from 18:56 to 22:14. Think about why an engineer designing a car bumper (resilience) and an engineer designing body armor (toughness) would prioritize different properties.
Test your understanding!
An engineer is selecting a material for an aircraft landing gear strut. They are considering two alloys:
- Alloy A: High yield strength, high modulus of elasticity (), but fractures at a relatively low strain (e.g., 5%).
- Alloy B: Moderate yield strength, moderate modulus of elasticity, but fractures at a very high strain (e.g., 20%).
- Which alloy is more ductile?
- Which alloy is stiffer?
- Which alloy likely has higher toughness? Why is this property critical for a landing gear?
Show answer
- Alloy B is more ductile. Its ability to withstand a high strain (20%) before fracturing is the definition of ductility.
- Alloy A is stiffer. Its higher modulus of elasticity () means it will deform less for a given amount of stress.
- Alloy B likely has higher toughness. Toughness (the area under the stress-strain curve) depends on both strength and ductility. The significantly higher ductility of Alloy B will likely give it a much larger area under its curve, even with a lower strength. This is critical for landing gear, which must absorb the massive energy of landing without shattering. A brittle failure would be catastrophic.
5. Applying Hooke's Law: Calculating Deformation
Now let's put these concepts to practical use. We can combine the formulas for stress, strain, and Hooke's Law to directly calculate the total deformation () of an axially loaded member.
We know:
Substituting (1) and (2) into (3):
Rearranging to solve for the deformation, , gives us a very useful formula:
(Note: is often just written as )
This formula is a cornerstone of mechanics of materials. It elegantly combines the load (), geometry (), and material properties () to predict performance.
Let's use it to solve a problem.
Stress-Strain Curve Explained Definitions, Formulas, ...
The following resource provides clear, formula-based examples. We'll focus on one to see how to apply what we've learned.
Please read through 'Example 1' in the 'Sample Problems on Stress and Strain Curve' section. This shows how to extract the Modulus of Elasticity (Young's Modulus) and Yield Strength directly from a graph.
Now let's try our own problem using the combined formula:
Problem: A 3-meter-long solid circular aluminum bar must support a tensile load of 25 kN. The maximum allowable elongation is 2.5 mm, and the yield strength of the aluminum is 270 MPa. For aluminum, GPa. What is the minimum required diameter for the bar?
Solution:
-
Identify Knowns and Unknowns:
- We need to find the minimum diameter, which means we first need to find the minimum area, .
-
Calculate Required Area based on Elongation:
- Start with the deformation formula:
- Rearrange to solve for Area:
- Substitute values:
-
Check Stress against Yield Strength:
- We must ensure the stress in the bar doesn't cause it to yield.
- Since 58.3 MPa is much less than the yield strength of 270 MPa, the design is safe from yielding. The controlling factor is the elongation limit.
-
Calculate the Required Diameter:
- The area of a circle is .
- Rearrange for diameter:
- So, the minimum required diameter is 23.3 mm.
Conclusion
Today we've demystified the stress-strain curve and shown how it serves as a rich source of information about a material's behavior. This graph isn't just an abstract plot; it's a practical tool that governs engineering design.
Key Takeaways:
- The stress-strain diagram is a material's mechanical "fingerprint," obtained from a tensile test.
- The initial linear portion is the elastic region, where the material returns to its original shape and behavior is described by Hooke's Law ().
- The Modulus of Elasticity () is the slope of the elastic region and represents the material's stiffness.
- Key points on the curve define material properties: Yield Strength (onset of permanent deformation), Ultimate Tensile Strength (maximum stress), and Fracture Strength.
- The shape of the curve tells us if a material is ductile (large plastic deformation) or brittle (little to no plastic deformation).
- The area under the curve quantifies energy absorption: resilience (elastic energy) and toughness (total energy to fracture).
Next Lesson Preview:
So far, we've focused on normal stress, caused by forces perpendicular to a surface (pulling or pushing). But what happens when forces act parallel to a surface, like when a rivet or bolt is sheared? In our next lesson, we will investigate shear stress and strain, as well as the related concept of bearing stress in connections. This will expand our ability to analyze how real-world components and joints handle loads.
Can't find a good explanation? Sign up and we'll make it for you
Sign up