
Welcome back. In the previous Physics lesson, you focused on making reliable measurements: choosing suitable instruments, reading scales, and recording values with appropriate units and precision. Those skills now become data for describing motion.
In this lesson, you will calculate speed from measured distance and time, and from the gradient of a distance–time graph. You will also learn how the shape and steepness of a graph communicate what an object is doing. These are foundational skills for later work on acceleration and forces.
Speed: distance covered per unit time
Speed tells us how fast an object is moving. More precisely, it states how much distance an object travels in a given time.
The fundamental equation is:
Using symbols commonly seen in Physics:
where:
- is speed
- is distance travelled
- is time taken
If an object covers a large distance in a short time, it has a high speed. If it covers the same distance over a longer time, its speed is lower.
Watch FuseSchool’s short explanation and worked example before continuing.
Speed Distance Time | Forces & Motion | Physics | FuseSchool
Watch “Speed Distance Time” by FuseSchool - Global Education. It introduces speed as a rate, demonstrates the calculation with correct units, and shows why common units are essential when comparing speeds.
Watch speed and formula for the definition and the 100 m sprint example. Then watch consistent units to see why quantities must be converted before speeds can be compared.
A speed unit always combines a distance unit and a time unit. The standard Physics unit is metres per second, written or .
For example, a runner travels in :
The answer means that, on average, the runner covered every second.
A reliable method for numerical speed calculations
Use a clear structure in calculations. This earns method marks in structured questions and makes unit mistakes easier to spot.
Example: A cyclist travels in . Calculate the cyclist’s speed.
Start with the equation:
Substitute the values, including units:
Calculate:
The cyclist’s speed is therefore:
Average speed
In most numerical questions, the formula calculates average speed:
“Total” matters. Suppose a student runs to a wall and then back, taking altogether. The total distance is not ; it is:
So:
Even though the student finishes where they started, they have still travelled .
A quick reasonableness check
Before finalising an answer, check whether it makes physical sense:
- Dividing distance by a larger time should give a smaller speed.
- A speed in should result only when distance is in metres and time is in seconds.
- A person walking at is clearly unreasonable; this suggests a conversion or calculator error.
Units: convert before you divide
Questions may use kilometres, centimetres, minutes, or hours. You must ensure that the units fit the required answer.
For an answer in :
- convert kilometres to metres;
- convert centimetres to metres where necessary;
- convert minutes or hours to seconds.
Useful conversions are:
Example: A boat travels in . Calculate its average speed in .
Convert the distance:
Convert the time:
Now calculate:
Do not divide by and label the answer . That calculation would use kilometres per minute, which is a different unit.
You may also encounter road speeds in . To compare one speed in with another in , convert one so that both have the same unit.
A useful relationship is:
Therefore:
and:
For example:
Reading a distance–time graph
A distance–time graph displays how distance changes as time passes.
- The horizontal axis shows time.
- The vertical axis shows distance.
- The units written on each axis matter.
The central idea is:
The gradient of a distance–time graph represents speed.
Read the BBC Bitesize worked example now. It shows the calculation directly from changes in distance and time on a straight-line graph.
Read “Distance-time graphs” from BBC Bitesize. It connects the speed equation to the gradient of a graph and provides a short worked example.
In the “Distance-time graphs” section, begin with the paragraph immediately after the embedded video. Read the worked graph example. Focus on why the calculation uses the change in distance divided by the change in time.
The supplied Constant Motion Graph shows a straight line passing through points such as , , and .
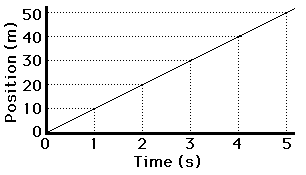
Using the points at and :
So the gradient, and therefore the speed, is:
The object covers the same in every second.
Calculate gradient, not simply final distance divided by final time
For a straight line through the origin, dividing the final distance by the final time happens to work. However, the safer general method is always:
For a distance–time graph:
Consider a line that passes through and . Its gradient is:
Choose two points that lie clearly on the plotted line, preferably far apart. A larger triangle makes small reading errors less important.
What the shape of the graph tells you
The graph is a visual description of motion. Before calculating, look at its overall shape.
| Graph shape | Meaning |
|---|---|
| Straight rising line | Constant speed |
| Steeper straight rising line | Constant speed that is greater |
| Horizontal line | Stationary; speed is |
| Curve becoming steeper | Speed is increasing |
| Curve becoming less steep | Speed is decreasing |
Two common errors are worth avoiding:
-
A high line does not necessarily mean high speed.
An object may be far from its starting point but currently stationary. A horizontal line at means it is at that distance and is not moving. -
A steep line represents high speed.
It is the gradient, not the vertical height of the line, that tells you the speed.
The exact scale of each axis also matters. A line that looks steep may not represent a high speed if the vertical axis has a small scale or the time axis has a large scale. Always calculate from the values on the axes.
Distance, position, and returning journeys
Strictly, a graph showing total distance travelled cannot slope downward, because the total distance covered never decreases.
Some exam graphs label the vertical axis as position or distance from the starting point. Such a graph may slope downward when an object returns towards its starting point. In that case, a negative gradient shows a change of position in the opposite direction. For now, when asked for speed, use the magnitude of the gradient: speed is not negative.
Curved graphs and speed at a particular moment
A straight line has constant gradient, so the speed is the same everywhere on that line.
A curved distance–time graph has a changing gradient. This means that the object’s speed is changing. The gradient between two points on the curve gives the average speed over that interval, not necessarily the speed at every instant within it.
To find the speed at one particular instant on a curved graph:
- Draw a tangent that just touches the curve at the required point.
- Choose two well-separated points on the tangent.
- Calculate the tangent’s gradient using change in distance divided by change in time.
The gradient of the tangent gives the speed at that instant.
Return to BBC Bitesize for its visual explanation of finding speed from a curved graph.
Under “Distance-time graphs for accelerating objects - Higher”, read from the sentence beginning the tangent method. Focus only on the tangent and gradient method; acceleration itself will be developed later in the Physics sequence.
Exam-ready routine for graph questions
When a question asks you to calculate speed from a distance–time graph, use this routine:
- Read the axes and note their units and scales.
- Select two clear points on the line, or on a tangent if the line is curved.
- Calculate the changes in distance and time.
- Use the gradient equation:
- Give the answer with the correct unit, usually .
- For a non-linear graph, state whether your answer is an average speed over an interval or speed at a particular moment.
A complete response looks like this:
The calculation shows the chosen graph values, the method, and the unit. That is exactly the clarity needed in an O Level response.
Key takeaways
Speed is the distance travelled per unit time:
- Use metres and seconds to obtain speed in .
- Convert units before substituting values into the equation.
- Most questions using total distance and total time ask for average speed.
- On a distance–time graph, speed equals gradient.
- A straight rising line represents constant speed; a horizontal line represents zero speed.
- A steeper graph has a greater speed, provided the axis scales are taken into account.
- For a curve, the gradient between two points gives average speed over that interval; the gradient of a tangent gives speed at one instant.
The next scheduled lesson moves to Computer Science, where you will convert positive integers between binary, denary, and hexadecimal. In the Physics strand, these graph-reading skills will soon support calculations of acceleration from velocity–time graphs.
Can't find a good explanation? Sign up and we'll make it for you
Sign up