
Good to see you again. In the previous lesson, you identified the important separation between the TradeLocker platform and the broker or prop firm connected to it. That means the next step is deliberately modest: build a workspace where you can learn the platform without depositing, connecting a broker account, or placing anything in a live environment.
This is a useful reset from the cycle of trying to force entries. For now, the goal is not to catch a gold move or imitate someone else’s execution speed. It is to make sure that when you later study breakouts, every chart and ticket action happens in a controlled demo environment.
Establish a hard demo-only boundary
A TradeLocker demo uses virtual funds. It can show live market data and allow simulated orders, but it should remain separate from any broker, prop-firm evaluation, or live account.
How to Open TradeLocker Demo Account - TradeLocker
Read TradeLocker’s official demo-account guide first. It explains the standalone demo route, which does not require a broker or prop-firm account, and identifies the platform’s demo indicator.
In “What is a TradeLocker Demo Account?”, read the demo explanation. Then continue to “Step 4: Place Your First Trade,” but treat it as an interface tour only: read the demo and ticket guidance without placing a trade.
Use these as non-negotiable safety checks before you configure anything:
- Use the standalone TradeLocker demo, not a broker login, prop-firm login, evaluation account, or funded account.
- Find the DEMO badge before touching the order panel. TradeLocker’s guide says it confirms that the account uses virtual funds. Its exact location can vary slightly by screen layout.
- Do not add funds, connect a broker, link prop-firm credentials, or select a live account.
- Disable one-click trading before opening an order ticket.
- At the end of this lesson, your Trades panel should show zero open positions and zero pending orders.
The account-switching screenshot below shows why account mode deserves attention. A live account can sit beside demo accounts in the same account list. Do not use the “Switch to Live” option as part of this course practice.
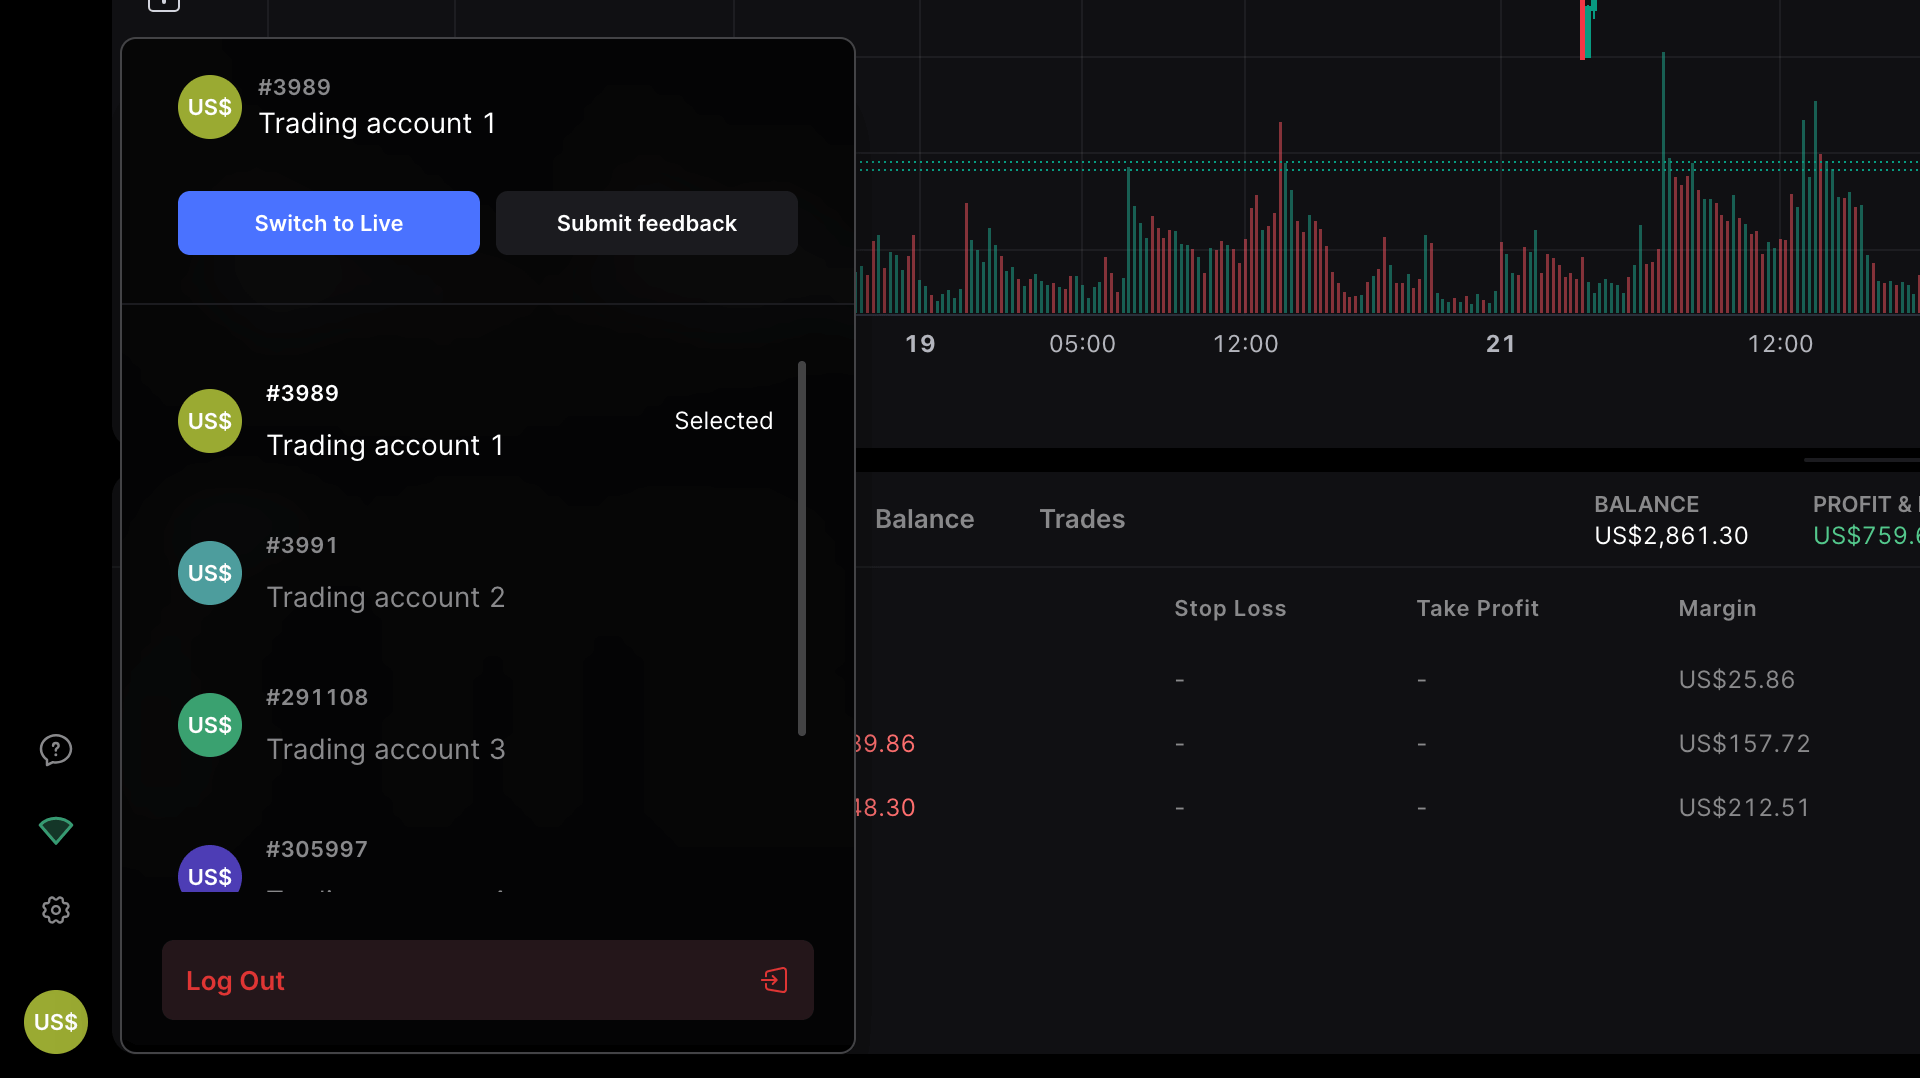
A simple rule:
If the account does not clearly say DEMO, close the platform or switch back before continuing.
Demo trading is still not a test of whether a strategy is profitable. It is a test of whether you can read a chart, prepare an order, and follow a process without making a platform mistake. The virtual balance may also be far larger than any account you would realistically use, so do not let that number influence how large a position looks “normal.”
Learn the workspace before using the ticket
TradeLocker divides the screen into a chart area, markets list, order panel, trades panel, and sidebar. You do not need to master every drawing tool now. You only need a clean chart, the correct gold symbol, and enough knowledge of the panels to avoid clicking blindly.
How to navigate the TradeLocker interface
Use this official guide to map the controls on your own screen. Focus on where chart settings, instrument search, account switching, and one-click trading controls are located.
In Section “1. Chart Panel,” read the chart controls, paying attention to time frame, chart style, indicators, and drawing tools. Then read Sections “2. Markets panel” and “3. Order panel” for the instrument search and order controls. Finally, in “5. Sidebar,” read the account controls; note both account switching and the setting for enabling or disabling one-click trading.
For a visual tour of the same layout, watch the following segment. The presenter is showing a prop-firm account, not a standalone demo, so use it only to recognize the panels. Do not copy the account connection or order-execution parts of the wider video.
How To Use TradeLocker Tutorial 2024 (with Prop Firms)
In “How To Use TradeLocker Tutorial 2024,” AquaFunded gives a visual tour of the TradingView-based chart, Markets, Order, and Trades panels. Watch it to orient yourself, not to set up a prop account.
Watch the panel tour. Notice the chart controls at the top and left, the Markets panel used to locate instruments, the Order panel, and the Trades panel. Stop at the end of this range, before the video begins demonstrating order placement.
Here is the job of each panel for this lesson:
| Panel | What you use it for now | Safety point |
|---|---|---|
| Chart | Viewing your gold price chart | Analysis only; no trade is needed |
| Markets | Searching for the exact gold symbol | Use the symbol specifications you checked earlier |
| Order | Learning where order type, size, stop loss, and take profit appear | Opening it does not require submitting an order |
| Trades | Confirming there are no positions or pending orders | Check it before and after practice |
| Sidebar / profile | Finding settings and confirming account selection | Keep one-click trading disabled; do not switch accounts |
Configure a clean gold chart
Your first chart layout should reduce clutter rather than imitate a YouTuber’s screen.
-
In Markets, search for the exact gold symbol available in your demo. It may be labelled , Gold, or with a broker-specific suffix. Use the exact symbol you recorded when checking its contract details. Do not assume every Gold or XAUUSD listing has identical contract terms.
-
Select the symbol and check that the chart title changes to that same instrument. The instrument on the chart and the instrument in the order panel must match.
-
Set the chart style to candles.
-
Start with a 15-minute chart. It is a practical middle view for your later gold-breakout work: detailed enough to see intraday structure, but not as noisy as trying to make decisions from every tick.
-
Remove extra indicators for now. You have used RSI and stochastic before, but this course will first teach you to see swings, ranges, and breakout boundaries directly from price. A clean chart is not anti-indicator; it simply keeps the source of each decision visible.
-
If an indicator or tool remains on the chart by default, remove it unless it is necessary for basic display. Keep volume only if you want it visible, but do not interpret it as a signal yet.
-
Adjust zoom so you can see a useful amount of recent price action without squeezing candles into unreadable bars. You are creating a workspace for observation, not trying to predict the next move.
If the platform allows templates, save this as something clear such as Gold Demo Clean. The name matters because later you may test a different layout, and you do not want to wonder which chart had indicators or drawings added.
Make the order ticket safe before you make it useful
An order ticket is where a trade could be submitted. Configuring it is not the same as submitting it, but you should treat it with respect from the start.
The important distinction is:
- A draft is an unconfirmed setup visible in the ticket or on the chart.
- A pending order is a submitted instruction waiting for price to reach its entry level.
- A position is an already-open trade.
For this lesson, you may inspect or create a draft, but you finish with no pending order and no position.
The screenshot below shows stop-loss and take-profit controls attached to an already open UK100 position. It is useful for recognizing the controls, but do not copy the action shown: the panel is labelled “Edit Open Position,” meaning a trade already exists.
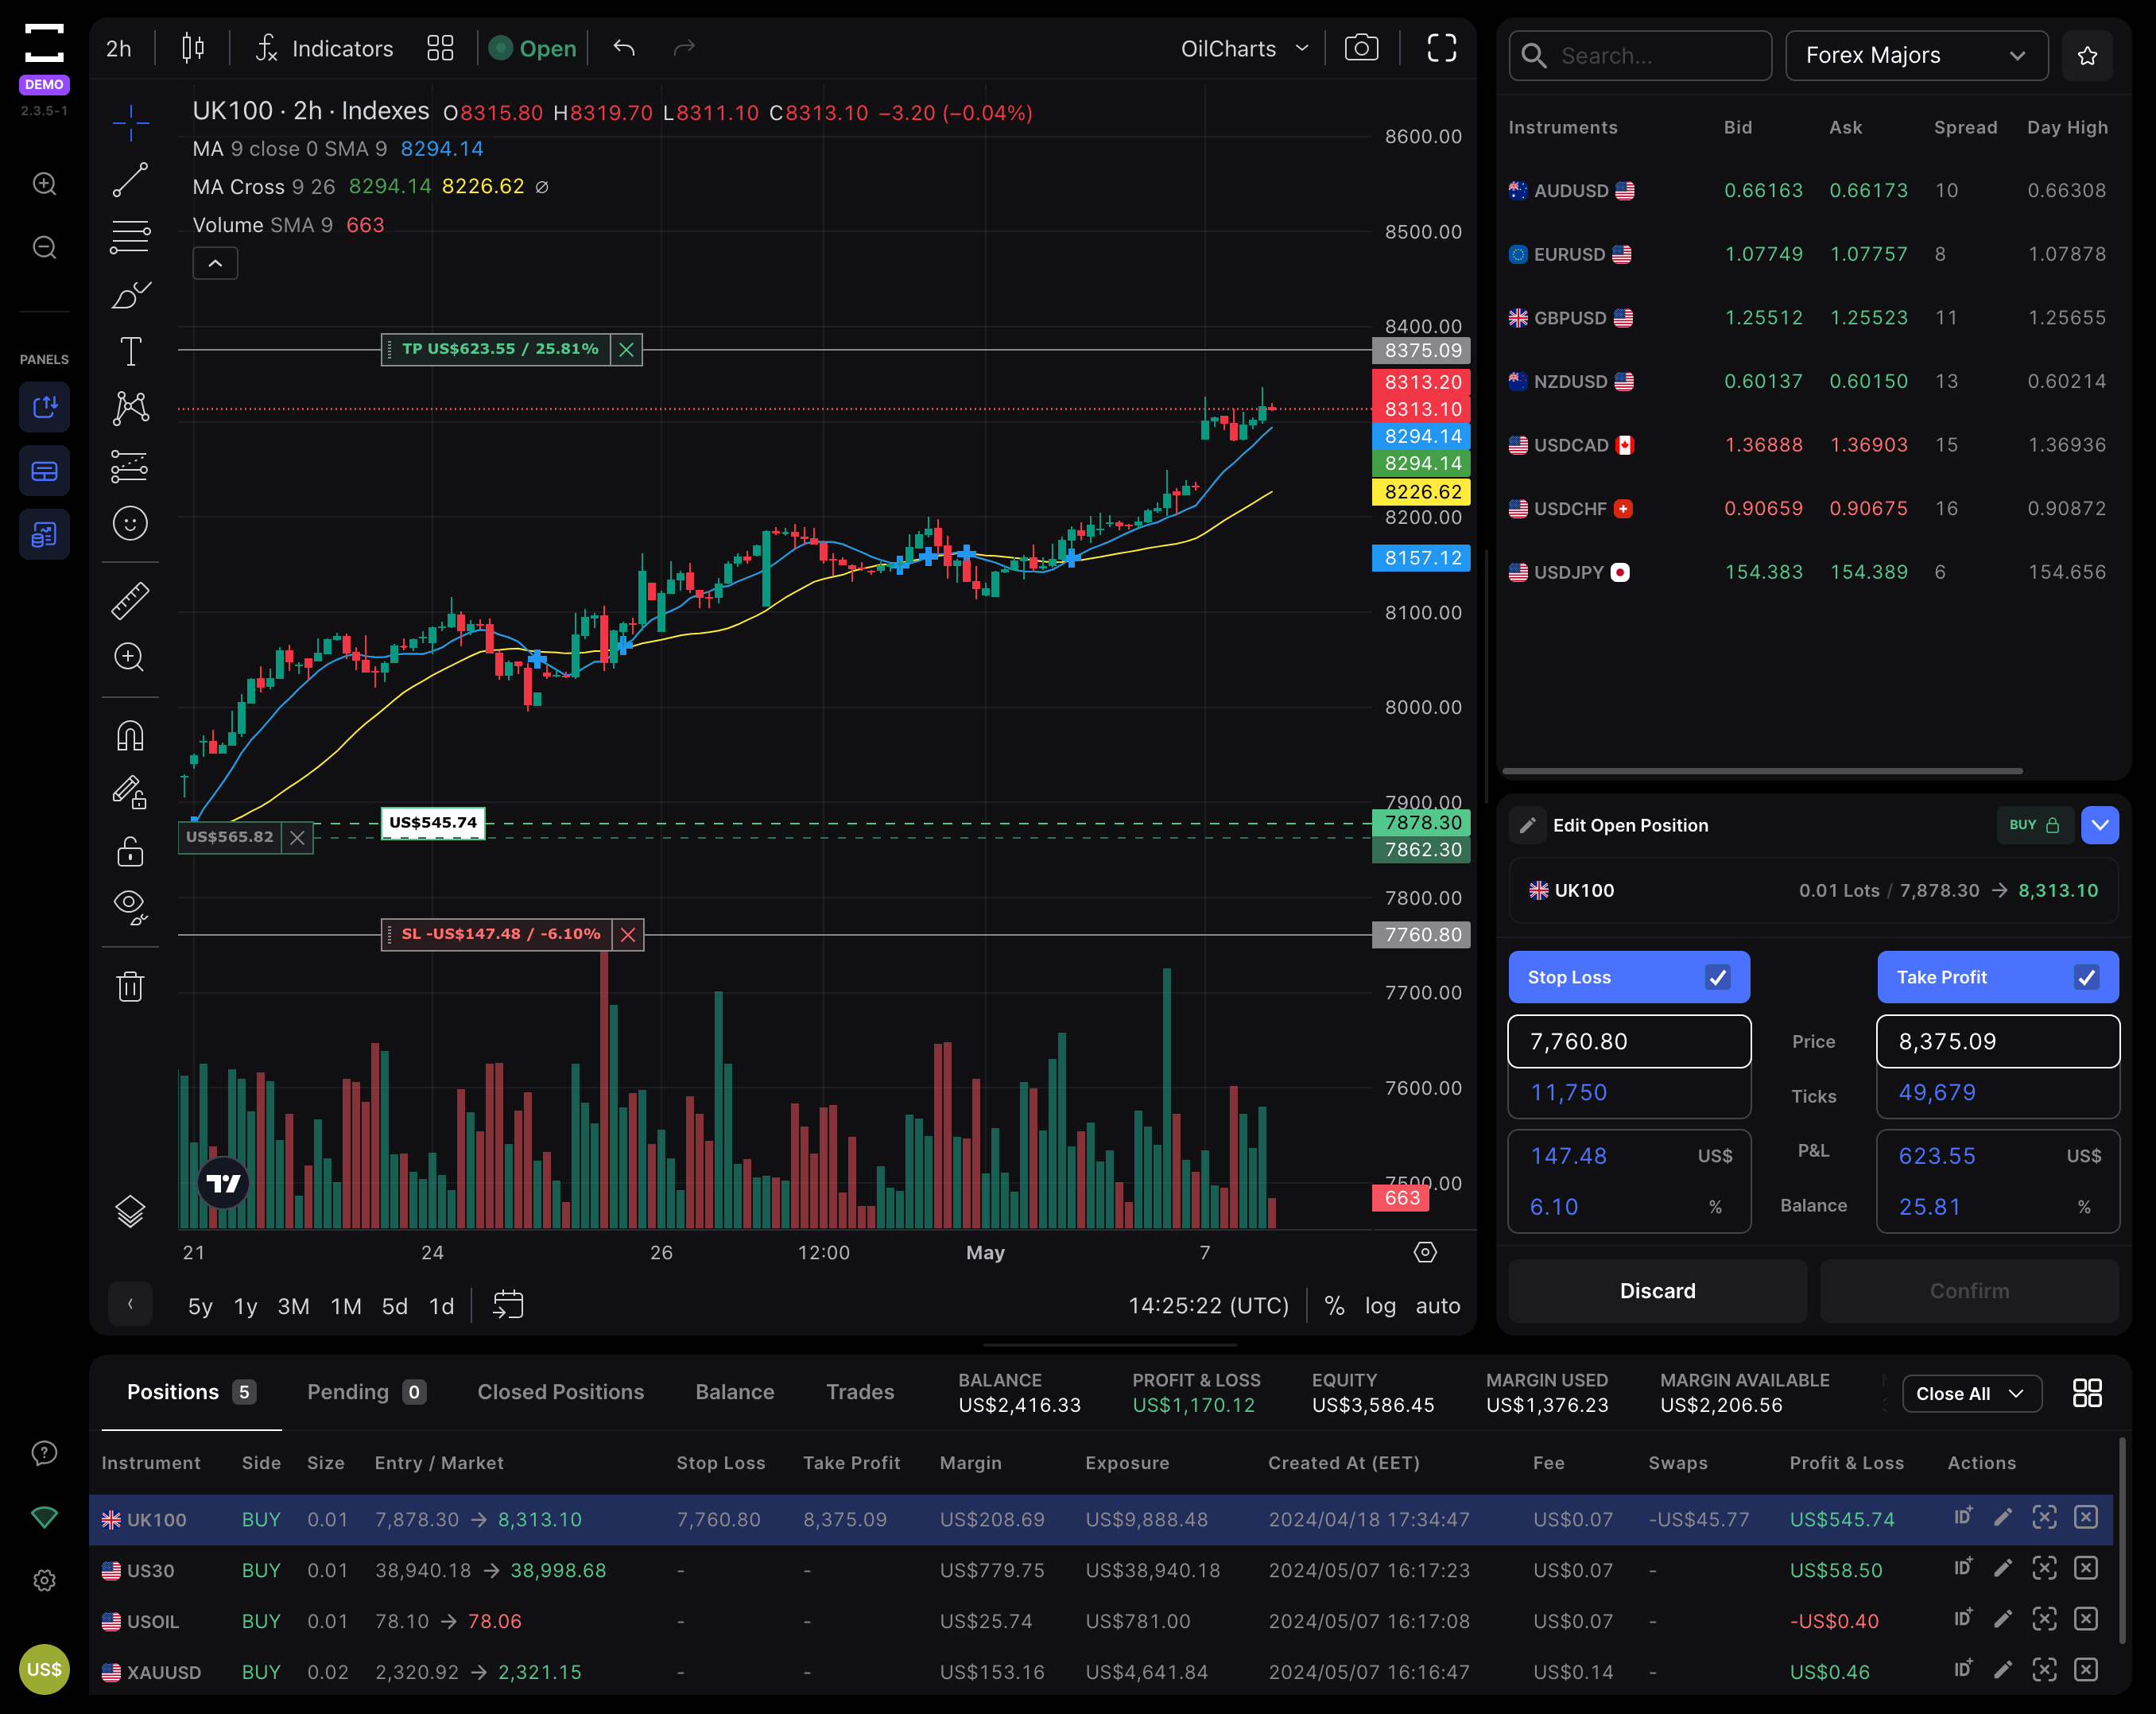
The controls you should be able to locate
Open the Order panel while the DEMO badge is visible. Identify these fields without pressing Buy, Sell, Confirm, or any button that submits an instruction:
| Ticket item | What it controls | What to verify |
|---|---|---|
| Instrument | The market you would trade | It matches the gold symbol on your chart |
| Market / Pending | Immediate simulated execution versus an instruction at a specified price | A pending order is still an order after submission |
| Buy / Sell | Direction of the trade | Do not click either action button in this lesson |
| Position size | Number of lots or units | It is not a risk percentage by itself |
| Stop Loss | Price at which the trade would be exited for a loss | A buy stop normally belongs below entry; a sell stop normally belongs above entry |
| Take Profit | Price at which the trade would be exited for a gain | A buy target normally belongs above entry; a sell target normally belongs below entry |
| Risk or profit/loss display | Platform estimate based on entered prices and size | Treat it as a check, not permission to take a trade |
A ticket can display a loss estimate and still represent a bad trade. It cannot judge whether price is ranging, whether a breakout is real, whether news is imminent, or whether the stop is structurally sensible. Those skills come later. Right now, your job is only to recognize what each field does.
A no-order ticket walkthrough
Perform this slowly, with the mouse away from Buy and Sell buttons:
-
Confirm the DEMO badge and confirm that one-click trading is disabled in Settings. If you cannot verify both, stop.
-
Open the Trades panel and establish a baseline: no open positions and no pending orders.
-
Open the Order panel. Confirm that its instrument matches your chart’s gold symbol.
-
Locate the selector for Market and Pending orders. Switch the display if you wish, but do not submit either type. The point is to see that a pending order requires an entry price, while a market order uses the current available price.
-
Locate the position-size field, Stop Loss control, Take Profit control, and any displayed estimated profit/loss or percentage field.
-
If your demo version clearly labels the lines or settings as Draft, you may move them briefly to understand the layout. Do not press any confirmation or execution control. If the interface does not clearly show a draft state, do not experiment with levels; simply identify the controls.
-
Close or reset the ticket. Reopen the Trades panel and verify again that there are no positions and no pending orders.
This walkthrough should feel uneventful. That is the correct result. You are building the habit of checking account mode and order state before trying to trade.
Your reusable pre-session safety check
Before looking at gold during either of your usual chart windows, use this 20-second sequence:
- Account: DEMO badge visible; no live account selected.
- Execution setting: one-click trading disabled.
- Instrument: exact gold symbol confirmed on both chart and ticket.
- Chart: candles on the 15-minute view; clutter removed.
- Order state: no old pending orders and no open positions.
- Intent: observation and practice only, not an impulsive entry because price is moving.
For the next few days, you can open the demo during your roughly 3:00 a.m. or 8:30–9:00 a.m. New York windows and simply observe how the gold chart behaves. Take a screenshot if you want, but do not draw conclusions yet from a handful of candles or from one spread reading. Later lessons will give you a structured way to read what you see.
Key takeaways
- TradeLocker’s standalone demo is the appropriate environment for platform practice; it uses virtual funds and does not require a broker or prop-firm account.
- Confirm the DEMO badge every time, and do not select a live account or connect outside credentials.
- Disable one-click trading before opening the ticket. This habit is valuable even when the current account is simulated.
- Build a clean 15-minute gold candlestick chart using the exact symbol available in your demo.
- Learn the order ticket’s fields, but do not press Buy, Sell, Confirm, or submit a pending order during this lesson.
- Finish every practice session by checking that the Trades panel contains no open position and no pending order.
Next, you will begin reading the chart itself: identifying the open, high, low, close, candle body, and wicks on a gold candlestick.
Can't find a good explanation? Sign up and we'll make it for you
Sign up