Hello! Welcome to the next lesson in our journey through core machine learning concepts.
Introduction
In our last lesson, we built a comprehensive toolkit for evaluating classification models. You learned how to use metrics like accuracy, precision, recall, F1-score, and AUC-ROC to understand a model's performance when predicting discrete categories.
Today, we shift our focus from classification to regression. The goal of a regression model is not to assign a label, but to predict a continuous numerical value—such as the price of a house, the temperature tomorrow, or the stock market index. Consequently, we need a different set of tools to measure its success.
This lesson directly addresses the learning outcome: Evaluate regression models using metrics like MSE, MAE, and R-squared. We will explore:
- How to quantify the error between predicted and actual values.
- The distinct properties of Mean Absolute Error (MAE) and Mean Squared Error (MSE), and when to use each.
- How Root Mean Squared Error (RMSE) makes MSE more interpretable.
- How R-squared (R²) provides a measure of how well your model explains the data's variability.
This lesson builds directly on the last one by completing your foundational knowledge of model evaluation. Where classification metrics are about counting correct and incorrect predictions, regression metrics are about measuring the magnitude of the error.
The Anatomy of an Error
In any regression task, the fundamental unit of performance is the error, also known as the residual. For a single data point, the error is simply the difference between the actual value () and the value predicted by your model ().
Our goal is to aggregate these individual errors across the entire dataset into a single, meaningful score. However, we can't just take the average of the errors. If a model predicts too high for one data point (a positive error) and too low for another (a negative error), these errors could cancel each other out, making the model seem more accurate than it is.
To solve this, we must ensure all errors are positive before averaging them. The two most common ways to do this are by taking the absolute value of the error or by squaring it. These two approaches form the basis of the most common regression metrics.
To see a clear visual explanation of this core concept, please watch the following short clip.
Understanding Mean Absolute Error and Mean Squared Error as ML metrics and loss functions
The video 'Understanding Mean Absolute Error and Mean Squared Error' from DigitalSreeni provides a great starting point by explaining why we need to process errors before summing them up.
Watch from 03:53 to 05:21. Focus on the intuition behind why simply adding up the raw errors is not a viable option for evaluating a model.
Error-Based Metrics: MAE, MSE, and RMSE
The most direct way to evaluate a regression model is to measure the average size of its errors. MAE, MSE, and RMSE are the workhorses for this task. The image below provides a handy visual summary of their formulas.
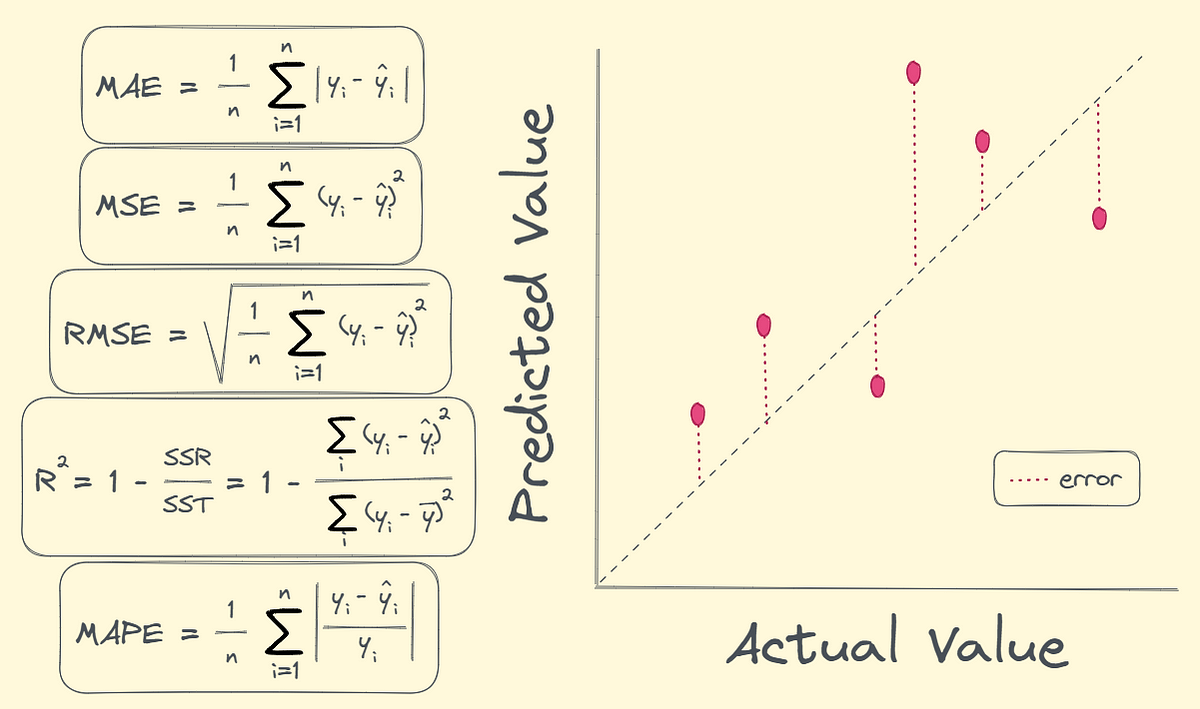
Let's break them down one by one. For a comprehensive overview, I recommend this reading from Towards AI.
The Essential Guide to ML Evaluation Metrics for Regression
The article 'The Essential Guide to ML Evaluation Metrics for Regression' by Ayo Akinkugbe provides clear definitions, case studies, and use cases for the metrics we're about to cover. It's a great reference to have open.
As we discuss each metric, I suggest you read the corresponding section in the article. Start by reading the sections titled 'Mean Absolute Error (MAE)', 'Mean Squared Error (MSE)', and 'Root Mean Squared Error (RMSE)'.
Mean Absolute Error (MAE)
MAE answers the simple question: "On average, how far off are my predictions?" It's calculated by taking the average of the absolute values of the errors.
- Interpretation: An MAE of $5,000 in a house price prediction model means that, on average, the model's prediction is off by $5,000.
- Key Property: It's in the same units as the target variable, making it highly interpretable. It treats all errors equally, so a $10,000 error contributes twice as much as a $5,000 error. This makes it robust to outliers.
Mean Squared Error (MSE)
MSE is calculated by taking the average of the squared errors.
- Interpretation: The units are the square of the target variable's units (e.g., dollars-squared), which is not intuitive for business stakeholders.
- Key Property: Because it squares the error term, MSE penalizes large errors much more heavily than small ones. A $10,000 error contributes 4 times more than a $5,000 error ( vs ). This makes MSE highly sensitive to outliers.
- Advantage in Optimization: From your background in computer science and mathematics, you'll recognize that the function is smoothly differentiable everywhere. This property makes MSE a very common choice for the loss function that algorithms like gradient descent minimize during model training. In contrast, the absolute value function is not differentiable at zero.
Root Mean Squared Error (RMSE)
RMSE is the square root of MSE. It was developed to address the interpretability problem of MSE while retaining its properties.
- Interpretation: RMSE is back in the same units as the target variable. An RMSE of $7,500 means the model's predictions have a typical error magnitude of $7,500.
- Key Property: Like MSE, it is sensitive to outliers. The RMSE will always be greater than or equal to the MAE, and the gap between them is an indicator of how large the errors are in your dataset.
When to Use MAE vs. RMSE/MSE?
The choice between MAE and RMSE is a critical one and depends on your objective.
- Use MAE when you want a metric that is robust to the effects of outliers and represents the average error magnitude. It's often better for reporting to business stakeholders.
- Use RMSE/MSE when large errors are particularly undesirable. If your model making a few very bad predictions is much worse than making many small errors, RMSE will highlight this issue more effectively.
The following clips demonstrate this crucial difference with a conceptual graph and a practical coding example.
Understanding Mean Absolute Error and Mean Squared Error as ML metrics and loss functions
We'll return to the DigitalSreeni video to see a fantastic visual and practical demonstration of how outliers affect MAE and MSE differently.
First, watch from 11:01 to 13:52. This part visually explains why MSE gives more weight to outliers by plotting the loss functions. Then, watch from 19:08 to 20:38 to see a concrete Python example where a single outlier dramatically increases the MSE but has a much smaller effect on the MAE.
Test your understanding!
You are building a model to predict the delivery time for a food delivery service. Which metric, MAE or RMSE, would you prioritize for evaluating your model's performance, and why?
Show answer
You would likely prioritize RMSE. In a food delivery context, a customer is much more frustrated by a delivery that is 30 minutes late than three deliveries that are each 10 minutes late. The squaring effect of RMSE heavily penalizes these large delays (outliers), aligning the metric with the business goal of minimizing very late deliveries and improving customer satisfaction. While MAE would give you the average delay, it wouldn't capture the disproportionate negative impact of extreme delays.
R-squared (R²): The Coefficient of Determination
While MAE and RMSE tell you about the magnitude of the error, they don't tell you if your model is actually better than a very simple baseline. This is where R-squared (R²) comes in.
R² measures the proportion of the variance in the dependent variable () that is predictable from the independent variables ().
To understand it, consider a naive baseline model that always predicts the mean of the target values (). The error of this baseline model is the Total Sum of Squares (). The error of your model is the Sum of Squared Residuals ().
R² is defined as:
- Interpretation:
- R² = 1.0: Your model perfectly explains 100% of the variance in the data.
- R² = 0.75: Your model explains 75% of the variance in the data.
- R² = 0.0: Your model is no better than the naive mean-predicting model.
- R² < 0.0: Your model is actively worse than just predicting the mean.
The following video provides an excellent, detailed explanation of R².
Evaluation Metrics For Regression - When & Why To Use What
The video 'Evaluation Metrics For Regression' from NeuralNine gives a great breakdown of R-squared, including its formula and its main limitation.
Watch from 03:24 to 09:41. This segment covers both R-squared and a related metric, Adjusted R-squared, which addresses a key weakness in the original R².
As mentioned in the video, a major drawback of R² is that its value will always increase or stay the same when you add more features to the model, even if those features are completely useless. This can be misleading. Adjusted R² fixes this by penalizing the score for the number of predictors in the model, making it a more reliable metric for comparing models with different numbers of features.
Practical Implementation and Summary
Let's see how simple it is to calculate these metrics in Python using the scikit-learn library. Your experience with Python and software development will make this part feel very natural.
import numpy as np
from sklearn.metrics import mean_absolute_error, mean_squared_error, r2_score

# Example ground-truth and predicted values
y_true = np.array([100, 150, 200, 250, 300])
y_pred = np.array([110, 145, 215, 240, 295])

# --- Calculate MAE ---
mae = mean_absolute_error(y_true, y_pred)
print(f"Mean Absolute Error (MAE): {mae:.2f}")
# Interpretation: On average, our model's predictions are off by $8.00.

# --- Calculate MSE and RMSE ---
mse = mean_squared_error(y_true, y_pred)
print(f"Mean Squared Error (MSE): {mse:.2f}")
# Interpretation: The average of the squared errors is 105.00 (in squared units).

rmse = np.sqrt(mse) # Or mean_squared_error(y_true, y_pred, squared=False)
print(f"Root Mean Squared Error (RMSE): {rmse:.2f}")
# Interpretation: The typical magnitude of error is $10.25.
# Note: RMSE > MAE, which is always true. The gap indicates some variability in error sizes.

# --- Calculate R-squared ---
r2 = r2_score(y_true, y_pred)
print(f"R-squared (R²): {r2:.4f}")
# Interpretation: Our model explains 94.75% of the variance in the target variable.
Here is a summary table to help you keep these metrics straight:
| Metric | Formula | Units | Sensitivity to Outliers | Best For... |
|---|---|---|---|---|
| MAE | $\frac{1}{n}\sum | y_i - \hat{y}_i | $ | Same as |
| MSE | Squared units of | High | Model optimization (as a loss function); use when large errors are especially costly. | |
| RMSE | Same as | High | An interpretable measure of error size that still penalizes large errors. | |
| R² | Unitless (often 0-1) | Indirect | Understanding the proportion of variance explained by the model; comparing against a baseline. |
Conclusion
You have now added the essential metrics for regression to your evaluation toolkit. You can now quantitatively assess the performance of models that predict continuous values.
Key Takeaways:
- Regression metrics measure the magnitude of the error between predicted and actual values.
- MAE provides the average absolute error and is robust to outliers.
- MSE and RMSE penalize large errors heavily due to the squaring operation, making them sensitive to outliers.
- The choice between MAE and RMSE/MSE depends on the business problem and whether large errors are disproportionately bad.
- R-squared (R²) measures the proportion of variance in the data that your model can explain, providing a measure of "goodness of fit" relative to a simple mean-based model.
Preview of the next lesson:
Now that you are equipped to evaluate both classification and regression models, it's time to start building them. In the next lesson, we will begin Module 3 by implementing the foundational regression algorithm: Linear Regression. You will also learn about L1 and L2 regularization, powerful techniques used to prevent overfitting and improve model generalization.