
Welcome to the course. Over the next four weeks, you will build a practical foundation for analysing markets across US and UK shares, commodity products, and major cryptocurrencies—using TradingView for chart work and paper trading before risking capital.
This first module establishes the workflow and vocabulary needed for everything that follows. The immediate question is not “Which style makes the most money?” but: what kind of decision are you making, what evidence does it require, and what risks does it expose you to? By the end of this lesson, you should be able to classify a planned market position as long-term investing, swing trading, or short-term trading—and recognise when the label does not match the actual behaviour.
Nothing here is investment advice or a recommendation to trade. Treat the examples as a framework for disciplined analysis and later paper-trading practice.
A trading style is a decision system, not a personality
All three approaches involve taking exposure to an asset whose price may rise or fall. What separates them is chiefly the planned holding horizon. That horizon changes the kind of information that matters, how often you must make decisions, and the ways a plan can fail.
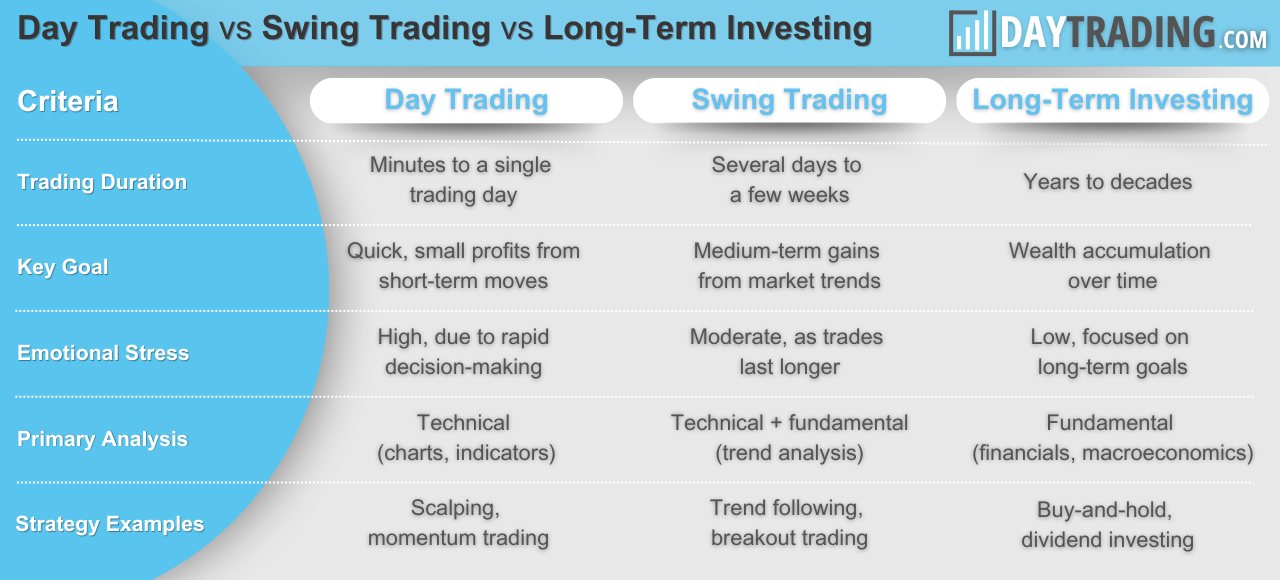
A useful first distinction:
- Long-term investing usually means holding for years, sometimes decades, because you expect a business, asset class, or diversified fund to create value over a long period.
- Swing trading usually means holding for several days to several weeks, occasionally longer, to capture a defined price move or a market reaction to a catalyst.
- Short-term trading, in this course, mainly refers to intraday or day trading: opening and closing positions within the same trading day, often in minutes or hours.
The critical word is planned. If you bought a share intending to sell it after a two-week earnings-driven move, then held it for three years because the price dropped, you did not become a long-term investor. You abandoned a swing-trading plan. Conversely, an investor may sell a holding after six months because the business thesis broke; the shorter actual holding period does not turn that decision into a swing trade.
The label should describe the original hypothesis, the evidence supporting it, and the rule for admitting that it is wrong.
Stock trading | Stock market for beginners
Read Fidelity's overview to establish the basic distinction between active trading, passive investing, and the main risk considerations. It gives a clear baseline vocabulary for the course.
Start in “What is trading?” and read the definitions, focusing on how the time horizon separates active trading from long-term holding. Then read the full “Types of trading” section, beginning with the three styles; note both the stated holding periods and the monitoring burden. Finish with “Risks of trading,” reading the risk discussion, especially the distinction between ordinary investment loss and leverage or margin risk.
The same chart can support three different decisions
Suppose the share price of a hypothetical UK-listed software company has fallen 12% after an earnings report. The chart alone does not tell you which style is appropriate. Three people can look at the same price movement and make fundamentally different decisions.
| Approach | Question being answered | Typical holding period | What success looks like |
|---|---|---|---|
| Long-term investing | “Will this business likely be worth substantially more over several years?” | Years | The business compounds value and the original thesis remains intact |
| Swing trading | “Is there a plausible price movement to capture over the next days or weeks?” | Days to weeks | Price reaches a defined target before the setup is invalidated |
| Short-term / intraday trading | “Is there a tradable imbalance in price and volume during this session?” | Minutes to one day | A small, well-defined intraday move is captured with controlled execution |
The long-term investor might investigate whether revenue growth slowed temporarily or whether the company’s competitive position has deteriorated. They may buy only if cash generation, balance-sheet strength, valuation, and long-run business prospects still justify ownership.
The swing trader may see a different opportunity: perhaps the price is approaching a well-tested support area, volume selling is fading, and the next results are six weeks away. Their thesis is not necessarily “this is a wonderful company.” It could simply be: “The market may reprice this oversold reaction over the next ten trading sessions.” That hypothesis needs an entry area, a target, and an invalidation level.
The intraday trader may care even less about whether the company is attractive. They might focus on the opening price, unusually high volume, a news release, liquidity, and price action around a level visible on a five-minute chart. The position must usually be closed by the end of the session, so the trade depends on the day’s order flow and volatility rather than multi-year business performance.
This is why an asset cannot be called “an investing stock” or “a trading stock” in the abstract. A liquid US large-cap share, a UK share, gold exposure, or Bitcoin can be analysed through any of these time horizons. The method changes the relevant evidence.
Evidence: what must be true for each approach?
A productive way to think about evidence is to ask: What would I need to know before committing capital, and what information could prove me wrong?
Long-term investing: business evidence dominates
For a long-term position, price is important—especially because valuation affects prospective returns—but it is not enough. The central evidence concerns the economic engine behind the asset.
For an individual company, that usually includes:
- Revenue growth and whether that growth is durable.
- Profit margins and free cash flow: does accounting profit translate into cash?
- Debt, liquidity, and the ability to survive a difficult period.
- Competitive advantages, customers, products, management incentives, and industry structure.
- Valuation relative to the company’s quality, growth, history, and comparable firms.
- A specific thesis: why the market may be underestimating future earnings power or resilience.
The decision is revisited when material facts change: a major loss of competitive advantage, an unsustainable debt burden, a broken growth assumption, or a valuation that no longer makes sense. Daily price changes alone are usually weak evidence. A long-term investor expects ordinary pullbacks and may hold through them; that does not mean ignoring genuine deterioration in the business.
This course’s next module will make those financial-statement and valuation terms concrete.
Swing trading: context plus timing
A swing trade needs two layers of evidence.
First comes context: why might a meaningful move occur during the intended holding period? Examples include an earnings reaction, a sector trend, a commodity supply development, a macroeconomic event, or a broadly improving market regime.
Second comes execution evidence: why enter at this price now? This is normally technical. A trader may use support and resistance, trend structure, volume, moving averages, or momentum to define the entry, target, and invalidation point.
The distinction matters:
- “Oil prices have been rising because supply is constrained” is context.
- “A liquid oil product broke above a multi-week resistance area on strong volume and held it on the next session” is closer to an executable trigger.
A swing trader is exposed while markets are closed. Overnight news, earnings surprises, gaps at the next open, and weekend events—especially in cryptocurrency—can move the price past a planned stop level. A stop is therefore a risk-control instruction, not a guarantee of exiting at the exact selected price.
Intro to Swing Trading Stocks: Strategies and Indicators
Watch Charles Schwab’s “Intro to Swing Trading Stocks: Strategies and Indicators” for a compact visual explanation of swing trading’s place between day trading and longer-horizon investing.
Watch the definition to anchor the usual days-to-weeks horizon. Continue with analysis style, noting that technical analysis is mainly used to time entries and exits rather than to prove a business is valuable. Then watch price swings, focusing on the idea of trading within the broader market direction rather than assuming prices move in straight lines.
Short-term trading: execution evidence dominates
Intraday trading compresses the decision cycle. Business fundamentals normally do not change meaningfully between 10:00 and 14:00, but prices can move sharply because of news, opening auctions, liquidity conditions, institutional order flow, or the collective reactions of other market participants.
An intraday plan therefore tends to require:
- A liquid instrument with a sufficiently tight bid–ask spread.
- Awareness of scheduled news and market-moving events.
- A clear session-level context, such as a strong opening move or a key price level.
- Defined entry, stop, target, and maximum daily loss rules.
- A repeatable execution process that accounts for commissions, spread, and slippage.
- Close monitoring during the position.
Technical analysis is useful here, but it is not an oracle. It is a structured way to observe price, volume, volatility, and market behaviour. Since short-term moves contain much more noise than multi-year business results, the quality of execution and risk control becomes especially important.
Risk is multidimensional
It is tempting to rank the styles simply:
day trading is risky; swing trading is medium risk; long-term investing is safe.
That is too crude to guide real decisions.
A concentrated long-term investment in a weak or overpriced company can lose a great deal over years. A diversified long-term portfolio can experience severe drawdowns during recessions or bear markets. A day trader who closes all positions before the close avoids overnight gap risk, but can still lose quickly from fast price movement, poor execution, excessive position size, or repeated small losses and costs.
Instead, compare the type of risk.
| Risk dimension | Long-term investing | Swing trading | Short-term / intraday trading |
|---|---|---|---|
| Market exposure | Extended exposure to business cycles, inflation, and long drawdowns | Exposure to multi-day price moves and changing sentiment | Exposure to rapid intraday volatility |
| Overnight gap risk | Present, but often tolerated within a long thesis | Material: a gap can exceed a planned stop | Usually lower if flat by the close, though not zero if positions are held |
| Execution risk | Relatively low frequency; price discipline still matters | Moderate; entry and exit timing affect reward-to-risk | High; spread, slippage, speed, and liquidity matter greatly |
| Transaction-cost drag | Usually low due to infrequent trading | Moderate | Potentially high because trades are frequent |
| Analysis error | Misjudging the business or valuation | Misreading both the setup and the catalyst | Misreading noisy price action or market conditions |
| Behavioural pressure | Patience during drawdowns; avoiding thesis drift | Avoiding impulsive exits and “just one more day” decisions | Fast decisions, overtrading, revenge trading, fatigue |
| Leverage danger | Can magnify long-term losses | Can magnify gaps and stop losses | Can cause rapid losses; particularly hazardous in volatile markets |
Two implications are worth retaining.
First, risk is not eliminated by a longer horizon. Time can help a sound, diversified investment thesis play out, but it cannot repair a business that fails, a portfolio that is too concentrated, or a purchase made at an unsustainable valuation.
Second, shorter horizons do not automatically mean smaller losses. A day trade may target a small price move, but a large position or leverage can turn a modest adverse movement into a meaningful account loss. Frequent trading also creates more occasions to make errors and pay trading costs.
For a beginner, avoid margin or other borrowed-money exposure. The Fidelity reading correctly emphasises that margin can produce losses greater than the cash initially committed. The course will later cover position sizing, stops, and paper-trade evaluation; these controls are prerequisites, not optional refinements.
Time commitment is part of the risk profile
Your available time is an operational constraint, not a detail to ignore.
With roughly 3–4 study hours per week, it is sensible to learn the full framework while treating intraday trading as an observational and paper-trading topic, not a default activity. Authentic day trading requires attention during specific market hours, fast execution, and substantial rehearsal. Trying to do it intermittently around a demanding full-time role can create a mismatch between the strategy’s requirements and the attention available.
Swing trading is generally more compatible with structured routines because the analysis can be done outside market hours. For example, a swing trader might review a watchlist in the evening, update alerts, check the economic calendar, and define plans for the following session. That does not make it easy: overnight risk and the need for disciplined exits remain.
Long-term investing requires less frequent action, but higher-quality periodic research. The time saved on daily monitoring should be reinvested in understanding the business, its financial statements, valuation, and diversification—not replaced with neglect.
A practical learning architecture for this course is:
- Learn long-term analysis to understand what assets and businesses you may be owning.
- Learn chart structure and technical tools to read market behaviour and plan swing trades.
- Observe short-term setups in TradingView, initially through Bar Replay and paper trading.
- Keep the strategies separate. A long-term portfolio thesis and a swing-trading experiment should have separate written rules, position sizes, and records.
That separation prevents a classic failure mode: calling a losing short-term trade an “investment” merely to avoid taking a planned loss.
A brief classification routine for TradingView
Before you build indicators or place simulated orders, practise classifying ideas correctly. Open TradingView and select any familiar, highly liquid symbol—for example, a large US or UK company, a broad-market fund, gold, or Bitcoin. You are not looking for a signal yet.
For each chart, write three one-sentence hypotheses:
- Long-term version: State a business or macro claim that would need years to play out. Identify one fact that would challenge it.
- Swing version: State a potential catalyst or trend for the next several days or weeks. Identify the price behaviour that would invalidate the setup.
- Intraday version: State what would need to occur during one session to justify attention—such as high volume around a significant level. Identify a time-based rule for being flat.
Then label each statement with its intended holding horizon. If the evidence and the horizon do not agree, revise it. For example, “I will buy because the company has excellent margins” does not justify a five-minute trade; “RSI looks oversold” does not justify a ten-year investment thesis.
This small routine reinforces a principle we will use throughout the course:
Context explains why an opportunity may exist; a trigger specifies when to act; invalidation states what proves the plan wrong.
Key takeaways
Long-term investing, swing trading, and short-term trading are distinguished primarily by their planned time horizon, but that horizon reshapes everything else:
- Long-term investing relies most on business quality, cash generation, valuation, and durable multi-year reasoning.
- Swing trading combines a catalyst or market context with technical timing, typically over days or weeks.
- Short-term trading relies heavily on session-level price, volume, liquidity, and precise execution; it demands the most continuous attention.
- Risk is not a single scale. Long-term investing has business and drawdown risk; swing trading adds gap risk; intraday trading intensifies execution, cost, and behavioural risk.
- A position should be judged by its original plan. Do not silently convert a failed trade into an “investment.”
Next, we will compare the markets you want to follow—US and UK shares, exchange-traded commodity products, and major cryptocurrencies—by what you actually own or gain exposure to, their trading hours, volatility, currency effects, and leverage hazards.
Can't find a good explanation? Sign up and we'll make it for you
Sign up