
Welcome to the course. Over the next five weeks, you will move from inspecting FlyWire reconstructions safely, through making and auditing proofreading edits, to querying versioned connectome data in Python and running a small segmentation-training proxy. The practical goal is to understand what FlyWire’s interface and data actually represent before changing anything.
This first lesson establishes the central chain of evidence: electron microscopy images are the primary observations; automated segmentation converts those observations into candidate neuron reconstructions; people proofread the candidates against the images; and the resulting reconstructed neurons and synapses form a connectome. By the end, you should be able to explain both the pipeline and why human review remains necessary even when the reconstruction begins with machine learning.
From tissue images to a navigable brain volume
A fly brain is not imaged as a ready-made 3D model. It is prepared for electron microscopy (EM), which produces extremely detailed grayscale images of thin physical sections of tissue. In these images, membranes, mitochondria, vesicles, and cellular processes appear as patterns of contrast. A neurite, meaning an axon or dendrite-like extension of a neuron, may be only a thin profile in any one section.
The underlying evidence is therefore a stack of 2D images. After the images are computationally aligned, the stack can be treated as a three-dimensional volume made of voxels: 3D pixels. This alignment matters: a small displacement between neighboring sections can make a continuous branch appear to jump or break.
At this stage, the volume is rich in biological detail but not yet a usable wiring diagram. The EM image answers:
“What does the tissue look like at this location?”
It does not, by itself, answer:
“Which pixels belong to the same neuron across the full brain?”
That second question is reconstruction.
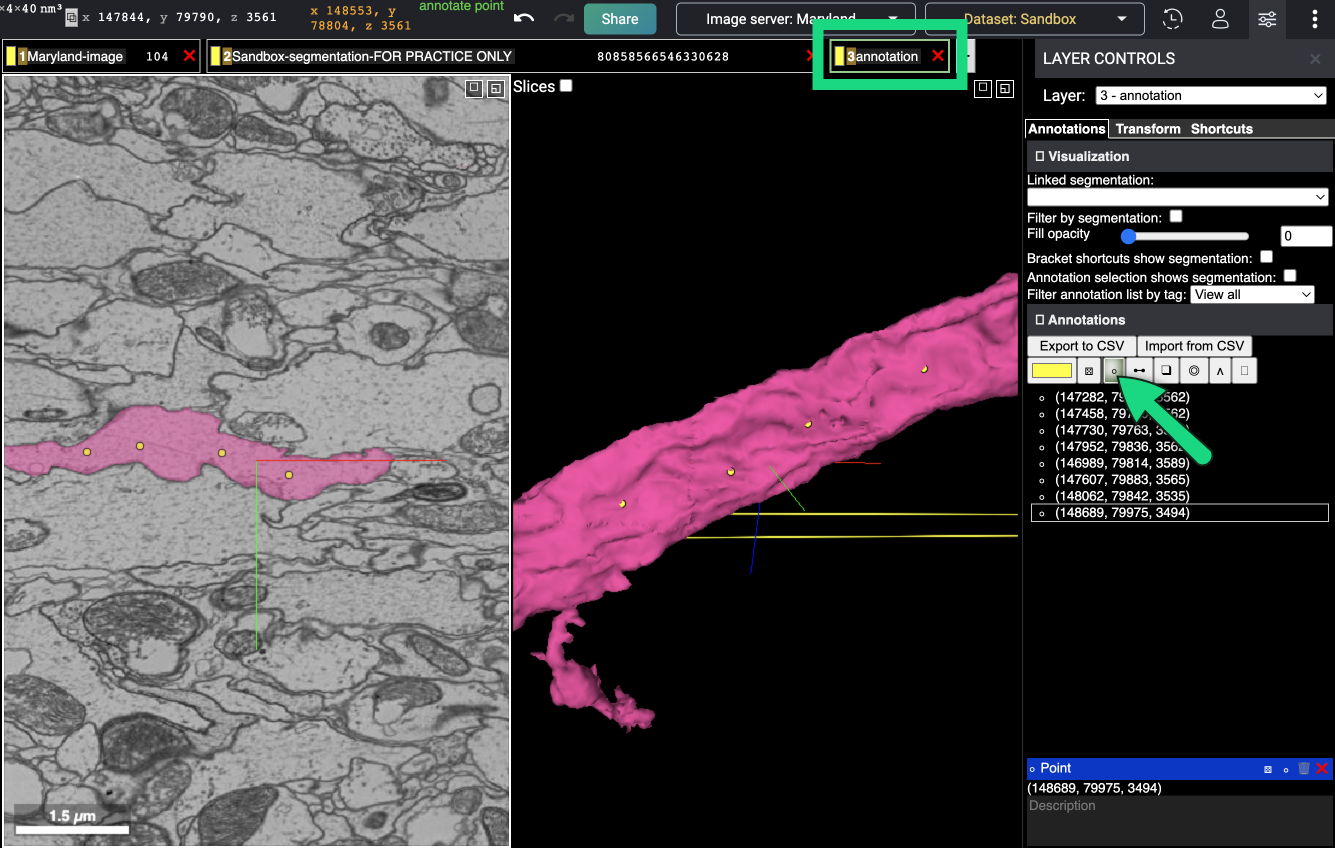
The pink object in this image is not simply “the neuron as photographed.” It is a hypothesis generated from image evidence: the system’s current claim about which voxels belong together.
Automated segmentation: converting image volume into candidate objects
Segmentation assigns labels to image voxels. In this context, the desired label groups together voxels that belong to the same biological structure while separating neighboring cells and processes.
A useful engineering distinction is:
- The EM volume is the raw measurement.
- The segmentation is a computed interpretation of that measurement.
- The 3D mesh is a visible surface rendering of a selected segmented object.
Machine-learning and other algorithms can process the enormous EM volume far faster than people can trace every cellular boundary manually. The result is a preliminary partition of the brain into many pieces that can be assembled into large, often nearly complete neuronal reconstructions.
FlyWire Overview and Data Types
Watch “FlyWire Overview and Data Types” from FlyWire Princeton for a compact statement of the project’s scale and the relationship between algorithmic segmentation, community review, neurons, and synapses.
Watch the overview. Focus on the sequence the speaker describes: a complete adult female fly brain is algorithmically partitioned, contributors correct the reconstruction, and the resulting dataset exposes a network of neurons and synapses.
The scale is why automation is indispensable, but segmentation is not equivalent to ground truth. A model sees local image patterns and continuity cues; EM data can be ambiguous because branches touch, run closely in parallel, become faint, or are distorted by imaging and sectioning artifacts.
Two broad reconstruction failures follow:
| Segmentation error | What the algorithm incorrectly claims | Visible consequence |
|---|---|---|
| False merge | Two distinct neuronal structures are one object | A reconstruction includes a branch that belongs to a neighboring neuron |
| False split | One continuous neuronal structure is separate objects | A genuine branch ends abruptly or is missing from the selected reconstruction |
There are also incomplete regions and cases in which the image evidence does not justify a confident decision. The key mindset is that the segmentation is a candidate reconstruction to test, not an authority that replaces the underlying EM imagery.
A compact way to hold the pipeline in mind is:
- Image acquisition: EM records the fly brain as a high-resolution stack of sections.
- Alignment and segmentation: computational methods align the images and label candidate cellular structures.
- Reconstruction: labeled voxels are rendered and organized as putative neuronal objects.
- Proofreading: reviewers compare those objects with the original images and correct well-supported errors.
- Connectome construction and release: validated neuron reconstructions, synapse information, and annotations become a queryable wiring dataset.
The first two stages make the problem tractable. The fourth stage makes the result scientifically defensible.
Why human proofreading is a distinct stage
FlyWire proofreading does not mean vaguely looking at an attractive 3D shape and deciding it “seems right.” It is an evidence-based review process. The reviewer moves through adjacent EM sections, checks whether a process continues through the image stack, and compares that evidence with the 3D reconstruction.
The 2D and 3D views have different jobs:
- 2D EM imagery is where membrane boundaries and local continuity are inspected. It is the primary evidence for deciding whether structures are physically continuous or separate.
- 3D segmentation rendering makes global morphology visible. It helps reveal suspicious fragments, unexpected branches, implausible joins, and the overall consequence of a proposed correction.
- Annotations and shared locations preserve the context of a decision so that it can be reviewed or revisited.
The interface image shows precisely this division of labor. The highlighted pink region overlays the EM section on the left, while the right panel gives a 3D view of that selected segment. Yellow points and the annotation list associate notes with positions in the dataset. In later lessons, you will configure these views and learn to inspect without editing before attempting any correction.
Read the opening and interface introduction of “FlyWire 101” from the FlyWire blog. It explains why FlyWire begins with large AI-produced reconstructions and frames the proofreader’s specific task: identify mistaken mergers and missing segments rather than build every neuron from scratch.
In “Technological improvements in FlyWire,” read the reconstruction overview, from the explanation of the EM dataset through the contrast with the earlier Eyewire workflow. Then continue into “FlyWire Proofreading 101,” especially “Interface Overview” and the first paragraphs on layers, stopping before “Sharing.” Focus on the practical meaning of Layer 2 as the 3D segmentation layer and on the separation between imagery, selected segmentation, and interface tools.
A correction can be powerful. If a false merge remains, it may assign synapses and branches from one cell to another. If a false split remains, it may make one biological neuron appear as two disconnected fragments. That is why proofreading is not merely cosmetic cleanup of a visualization. It determines which neuronal object subsequent analyses refer to.
At the same time, a careful proofreader does not force every ambiguity into an edit. When the evidence is insufficient, the correct scientific result is an unresolved or documented case. This course will emphasize that discipline before introducing merge and split operations.
From reconstructed neurons to a connectome
A connectome is a wiring diagram: a map of neurons and the synaptic connections among them. In a graph representation:
- each reconstructed neuron is a node;
- each synaptic connection is a directed edge from a presynaptic neuron to a postsynaptic neuron;
- edges may carry attributes such as synapse count, predicted neurotransmitter, spatial locations, and confidence or provenance information.
A connectome is therefore not the same thing as a segmentation. Segmentation answers, “Which voxels are part of this reconstructed cell?” A connectome adds the question, “Which reconstructed cells communicate with which others, and through how many synapses?”
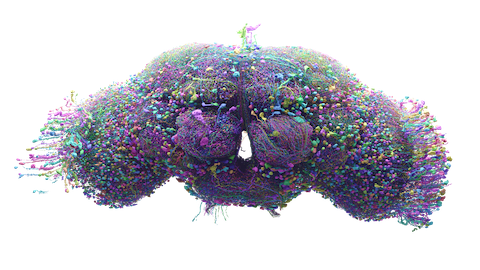
The relationship has a dependency structure:
| Dataset layer | Main unit | What it supports |
|---|---|---|
| EM imagery | Image pixels and voxels | Direct visual evidence of membranes, processes, and synaptic ultrastructure |
| Segmentation | Labeled voxel regions | Candidate cellular objects and 3D reconstructions |
| Proofreading records | Edits, reviews, annotations | Improved reconstruction and an account of how decisions were made |
| Connectome | Neurons and directed synaptic edges | Circuit-level analysis: partners, pathways, motifs, and neuron classes |
This also explains why reproducibility matters later in the course. A connectivity query such as “what are this neuron’s strongest output partners?” depends on a particular release or materialized version of the reconstruction. If proofreading improves a neuron’s boundaries, its identity, synapse assignments, or connectivity summary may change. A serious analysis records which version of the data it used.
The central idea: a chain of evidence, not a black box
The FlyWire project combines computational scale with human judgment:
- Algorithms make a brain-sized reconstruction feasible by producing candidate segments from EM data.
- Human reviewers test difficult cases against the original images, where local biological evidence is visible.
- Corrected, annotated reconstructions support a more reliable connectome.
- The connectome makes circuit-level questions computable, but its reliability remains connected to the reconstruction evidence beneath it.
Read FlyWire’s project description to consolidate the full workflow and the meaning of “connectome” in the context of the adult fruit-fly brain.
Read the connectome and reconstruction passage. Begin with the definition under “Connectome” and continue through “Reconstructing the connectome,” stopping before “Significance.” As you read, distinguish what automation contributes from what community proofreading contributes; neither alone is described as sufficient for the final resource.
For this course, treat the EM imagery as the evidence layer, segmentation as a fallible model output, proofreading as validation and correction, and the connectome as the structured scientific product built on those earlier layers. This framing prevents a common mistake: treating a colorful 3D neuron or a connectivity table as if it were direct observation rather than an interpretation with a traceable provenance.
Takeaways and next step
You have established the main concepts:
- EM provides the high-resolution image stack from which reconstruction begins.
- Automated segmentation labels the volume into candidate neuronal structures and makes large-scale reconstruction possible.
- Human proofreading checks those candidates against EM evidence, resolving well-supported false merges and false splits while preserving uncertainty when needed.
- A connectome organizes reconstructed neurons and their directed synaptic relationships into a wiring diagram.
- Any connectomics result inherits assumptions and possible errors from the reconstruction and version of data beneath it.
Next, you will enter the interface without editing and configure the 2D imagery, segmentation overlays, coordinates, and 3D view. The immediate objective will be modest but essential: make sure you can see the evidence and the model output clearly before trying to judge either.
Can't find a good explanation? Sign up and we'll make it for you
Sign up