
Hello! Welcome to the final lesson of this module. This is the last step in our journey of building and refining a Power BI dashboard.
In our previous lesson, we focused on the principles of effective dashboard design. You learned how to use layout, color, and the data-ink ratio to create a report that is not just functional but also professional, clear, and compelling. You should now have a polished financial dashboard that effectively tells a story with data.
Now that your masterpiece is ready, how do you get it in front of the right people? This lesson tackles that final, crucial step. Our learning outcome is to publish a Power BI report to the web and share it with stakeholders. We will cover how to move your report from your personal computer to the cloud and then explore the different ways to distribute it, whether to a private group of colleagues or to the public.
This marks the transition from being a solo creator to a communicator of insights.
1. From Desktop to the Cloud: Publishing to Power BI Service
So far, you've been working in Power BI Desktop, which is the application on your computer for creating reports. To share your work, you first need to publish it to Power BI Service, which is the cloud-based platform (accessible via a web browser) designed for sharing, collaboration, and viewing reports.
Think of Power BI Desktop as your kitchen where you prepare the meal, and Power BI Service as the dining room where you serve it to your guests.
Publishing is a straightforward process:
- Open your completed financial report in Power BI Desktop.
- Go to the Home tab on the ribbon.
- Click the Publish button.
- You will be prompted to sign in to your Power BI account if you haven't already.
- A dialog box will appear asking you to select a destination. For now, you will likely only have one option: My workspace. This is your personal sandbox in the Power BI Service. Select it.
- Click Select. Power BI will upload your report and its underlying data to the cloud.

Once published, you'll get a success message with a link to open the report directly in Power BI Service. Now, you're ready to share it.
2. An Overview of Your Sharing Options
In Power BI Service, there are several ways to share, but they fall into two main categories:
- Private Sharing: Sharing with specific people, typically within your organization. Viewers almost always need a Power BI account and a license (Pro or Premium). This method gives you tight control over who sees your report.
- Public Sharing: Making your report accessible to anyone on the internet via a public link. Viewers do not need a Power BI license or account. This is ideal for public-facing content or portfolios, but it comes with major security considerations.
To get a clear overview of the different ways you can share reports and when to use each one, the following article provides a very helpful comparison table.
Power BI Publish to Web: The Perfect Tool for Your Data ...
This article from DataCamp provides a clear comparison of the different ways you can share reports in Power BI, highlighting when to use each one.
Please read the section 'Comparing Publish to Web With Other Sharing Methods' and focus on the comparison table. Note the differences in Accessibility, Security, and Setup Complexity for 'Publish to Web' versus 'Share within Organization'.
Now let's dive into the two main methods.
3. Private Sharing: Collaborating with Colleagues
The most common scenario in a business environment is sharing your report with specific colleagues for feedback or decision-making.
Once your report is open in Power BI Service, you'll see a Share button at the top. This is your gateway to private sharing.
BEGINNERS GUIDE to SHARING REPORTS in Power BI // Generate Links, Manage Access and Permissions
This video from the 'Fernan | Power BI' channel provides a clear walkthrough of the private sharing process within the Power BI Service.
Watch from 00:37 to 03:37. Pay attention to: How to share by entering a colleague's name or email. The different link settings: 'People in your organization' vs. 'Specific people'. The options to allow (or disallow) recipients to reshare the report or to build new content from your dataset.
As the video shows, you have granular control:
- You can share with specific individuals or groups.
- You can control whether they can reshare the report with others.
- You can control whether they have Build permission, which allows them to connect to your report's dataset to create their own reports.
This method is secure and is the standard for sharing confidential or internal financial data.
4. Public Sharing: Showcasing Your Work to the World
For your goal of creating a portfolio of financial visualizations, the Publish to web feature is incredibly powerful. It generates a public link that allows anyone—potential employers, clients, or the general public—to view and interact with your report, without needing a Power BI account.
A Critical Warning: As someone in the financial markets field, this cannot be overstated: "Publish to web" makes your data public. Never use this feature for confidential, proprietary, or sensitive financial data. Once the report is public, you should assume anyone on the internet can see it. It is perfect for demonstrating your skills with non-sensitive, anonymized, or publicly available data (like historical stock prices from a public source).
With that in mind, here’s how it works.
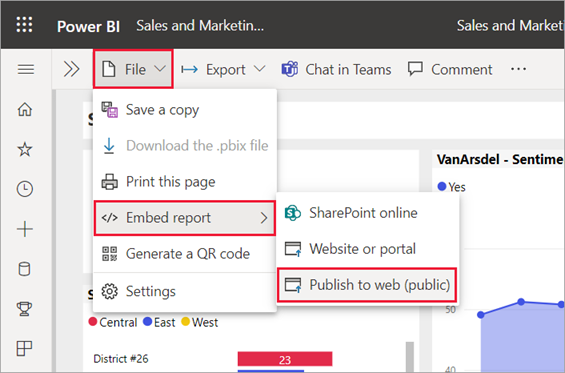
This next video walks you through the entire process, including a one-time setup step that may be required.
How to Share Power BI report OUTSIDE the ORGANIZATION
This video from 'BI Tricks' shows the end-to-end process for using 'Publish to web,' including how to enable the feature in the Admin settings if it's not already available.
Watch from 00:40 to 02:35. Note: The potential need to enable 'Publish to web' in the Admin Portal. In a corporate environment, you'd need an admin's help, but this is usually enabled by default in a personal account. The warning about not publishing confidential data, which you'll have to acknowledge. How to copy the public link or the HTML code to embed in a website.
Test your understanding!
You have created two different Power BI reports:
- A portfolio performance dashboard using your personal, real investment data.
- A market analysis dashboard visualizing 10 years of publicly available S&P 500 index data.
You want to share Report 1 with your financial advisor and share Report 2 on your professional blog to showcase your skills. Which sharing method is appropriate for each?
Show answer
- Report 1 (Personal Portfolio): Use Private Sharing (the 'Share' button). The data is highly sensitive and should only be shared with a specific person (your advisor), who should have a Power BI account to view it securely.
- Report 2 (S&P 500 Analysis): Use Publish to web. The data is public and not sensitive. This method generates a public link that you can easily embed in your blog for anyone to see, demonstrating your data visualization capabilities.
5. Managing Your Published Reports
Once something is on the internet, you need to know how to manage it or take it down. Power BI provides a central place to see all the reports you've published to the web and revoke access if needed.
It's just as important to know how to un-publish a report as it is to publish one.
How to Share Power BI report OUTSIDE the ORGANIZATION
The same video from 'BI Tricks' demonstrates how to manage your public links and delete them, instantly revoking access.
Watch from 02:52 to 04:01. Observe how to find the 'Manage embed codes' menu in the settings and how to delete a public link to make the report private again.
This is a vital step for maintaining control over your publicly shared content. If a report becomes outdated or if you realize it contains information that shouldn't be public, you can quickly and easily remove it.
Conclusion
Congratulations on completing the final lesson of this module! You have now covered the entire lifecycle of a Power BI project, from importing and cleaning data, to building insightful visualizations, to designing an effective dashboard, and finally, to sharing it with the world.
Key Takeaways:
- Publish to Power BI Service: This is the first step to sharing. It moves your report from your desktop to the cloud.
- Choose the Right Sharing Method: Use Private Sharing (the 'Share' button) for confidential data and internal collaboration. Use Publish to web for non-sensitive data intended for a public audience, like a portfolio.
- Security First: Never use "Publish to web" for any data you wouldn't want to see on the front page of a newspaper. For financial data, this is the golden rule.
- Manage Your Content: Regularly review what you have shared and know how to revoke access using the "Manage embed codes" setting.
You now possess a complete and powerful set of skills for financial data visualization. The next and final module of this course is the Capstone: Financial Visualization Project Lifecycle. In it, you will apply everything you have learned to plan, design, build, and present a financial data story from start to finish. This will be your opportunity to consolidate your knowledge and create a showcase project for your portfolio.
Can't find a good explanation? Sign up and we'll make it for you
Sign up