
Welcome back. Your VM is now designed to return to a known state without quietly weakening modern Windows protections. That baseline matters immediately: debugger output is only useful if you can tell whether a changed stack trace or module address reflects a new target build, a fresh ASLR layout, or simply an unresolved symbol.
This lesson configures WinDbg for native x64 user-mode work. You will establish three distinct search paths—symbols, source, and executable images—then validate Microsoft public symbols against a native system process. The same layout will be ready for the private PDBs and source files produced when you build laboratory targets in the next lesson.
1. The three maps WinDbg needs
A debugger starts with runtime addresses: for example, an instruction pointer within a loaded ntdll.dll, or a return address in your test application. Turning that address into something useful requires three different kinds of files.
| What WinDbg needs | Typical file/location | What it enables | What it does not do |
|---|---|---|---|
| Symbol path | PDB files; Microsoft symbol server; local cache | Function names, global names, type information, source-line mapping where available | It does not locate the target executable itself. |
| Source path | Your .c, .cpp, .h, and related files | Opening the local source file associated with a PDB’s source-line records | It does not create missing debug information. |
| Executable-image path | The original .exe and .dll files | Finding a module image when analyzing dumps or detached artifacts; accessing PE metadata and image bytes | It does not affect where Windows loaded the module in memory. |
The distinction is important in exploit development. An executable image tells you what bytes and PE metadata belong to a module; a PDB maps relative code locations to names and source; the source file tells you what the named code originally looked like.
With ASLR, a module’s load base can change on every clean launch. WinDbg handles that naturally when it has a matching image and symbols: it resolves a name to an RVA and combines it with the module’s current base. Therefore, prefer symbolic expressions such as Target!ParseRecord+0x34 over recording a raw virtual address as though it were stable.
A native x64 binary runs perfectly without a PDB. The PDB is a debugging artifact, not a loader requirement. But without a matching PDB, a crash often collapses into module offsets such as NativeLab+0x1a72, which makes precise root-cause work much slower.
Introduction to Windbg Series 1 Part 3 - Introduction To debug Symbols
Watch “Introduction To debug Symbols” from TheSourceLens for a compact explanation of what PDBs preserve and a demonstration of setting a symbol server path. The demonstration uses a 32-bit process, but the symbol concepts and commands apply equally to the native x64 targets used in this course.
Watch PDB purpose to distinguish runtime code from the debugging metadata that restores names, types, and source relationships. Then watch symbol setup for the symbol-path and reload workflow. Focus on the before-and-after change in stack readability, not the presenter’s 32-bit target choice.
2. Create a deliberate debugger workspace
Use directories with separate responsibilities. In the guest, open an elevated PowerShell window and create the following structure:
New-Item -ItemType Directory -Force `
  C:\Lab\Symbols\MicrosoftCache, `
  C:\Lab\Symbols\Private, `
  C:\Lab\Targets\NativeLab\x64\Debug, `
  C:\Lab\Source\NativeLab
The directories may be empty today. They establish a predictable contract for the coming labs:
MicrosoftCacheis a download cache only for Microsoft public symbols.Privateis for PDBs you intentionally preserve outside an individual build output directory.Targets\NativeLab\x64\Debugwill contain the x64 executable, DLLs, and matching PDBs for a laboratory build.Source\NativeLabwill contain the corresponding source tree.
Do not use the Microsoft symbol cache as a place to manually copy target PDBs. A symbol-server cache has its own organization and should remain separate from files you manage directly.
Now install and run the x64 edition of WinDbg inside the guest using your approved Microsoft distribution method. Keep the main lab VM isolated by default. An empty local cache cannot download new Microsoft symbols while the VM has no network path. For the initial symbol population, use the controlled, time-bounded provisioning workflow established in the previous lesson: temporarily provide approved connectivity, obtain only the needed symbols, then return the VM to Lab-Private and checkpoint the debugger-ready state.
The following reading explains why the semicolon-separated symbol path is an ordered search list and why a local cache is worth using.
Configure Symbol Path: Windows Debuggers - Microsoft Learn
Read Microsoft Learn’s “Configure Symbol Path: Windows Debuggers” to understand the order in which WinDbg searches for PDBs and the exact srv* syntax used for Microsoft’s public symbol server.
In the “Symbol path syntax” section, read the matching discussion. The point is that a plausible file name is not enough: debugger artifacts must match the binary under analysis. In “Control the symbol path,” read the configuration methods. For this course, use interactive commands first; that makes the active configuration visible in the command log. In “Using a symbol server: srv*,” read the server and cache examples. Compare the simple srv* form with the explicit local-cache form before entering the commands below.
3. Configure the symbol path
In WinDbg’s Command window, enter the following as separate commands:
.sympath C:\Lab\Targets\NativeLab\x64\Debug;C:\Lab\Symbols\Private;srv*C:\Lab\Symbols\MicrosoftCache*https://msdl.microsoft.com/download/symbols
.sympath
The second command displays the active configuration. Read the first command from left to right:
- Search the target build-output directory first. This is the normal location for your own matching PDB.
- Search your separately curated private-symbol directory next.
- If necessary, query Microsoft’s public symbol server, placing downloaded files in
C:\Lab\Symbols\MicrosoftCache.
This explicit form is preferable to an unqualified srv* for the lab because it records exactly where the cache belongs. WinDbg also offers the convenient reset command:
.symfix C:\Lab\Symbols\MicrosoftCache
.symfix resets the symbol path to the Microsoft public symbol-server default with that cache. It is useful when troubleshooting, but note the word resets: run it before adding any private paths, or re-enter the full explicit path afterward.
A symbol search path is not merely a directory list. It determines the search order, and symbols must match the image identity WinDbg expects. If you rebuild NativeLab.exe, treat its newly generated PDB as part of that new build. Do not keep an old NativeLab.pdb under the same name and assume the debugger will accept it.
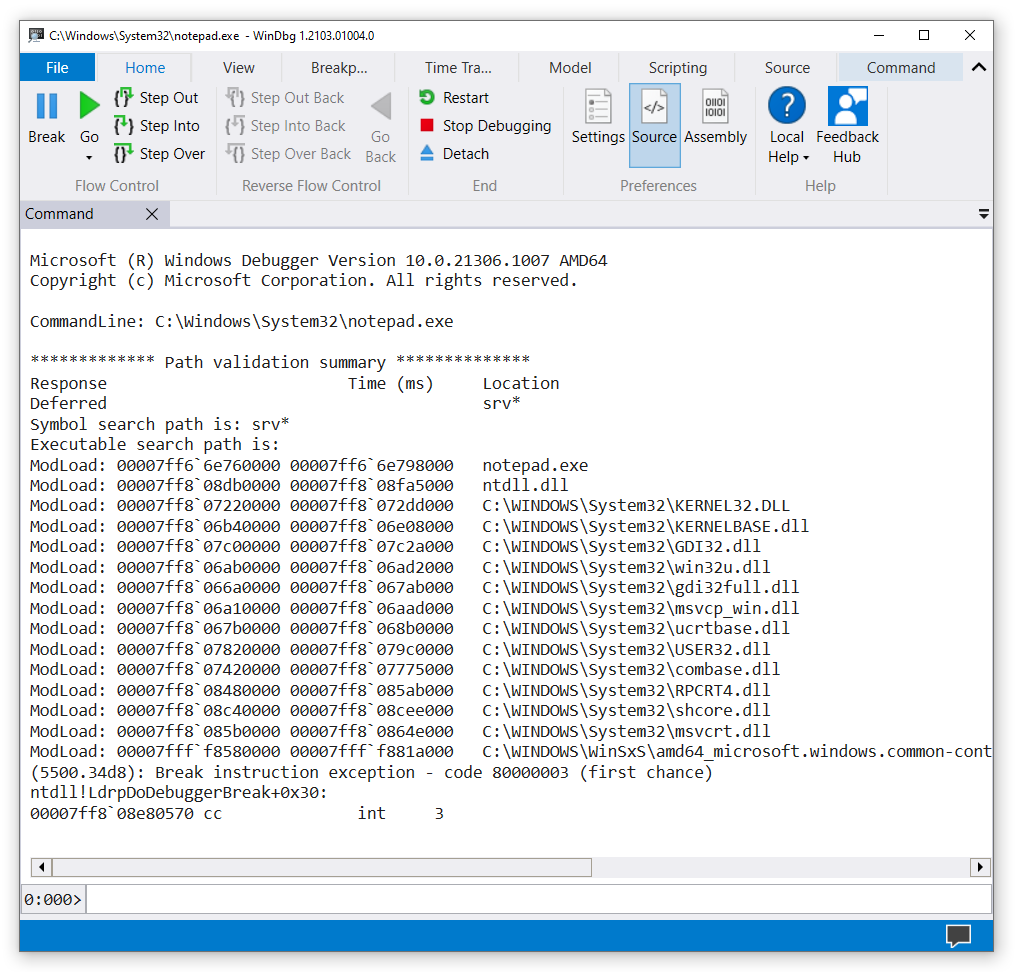
The provided WinDbg startup screenshot shows the early state of a debug session: module-load messages, the current symbol path, and the initial debugger break before application code has begun executing.
A useful operational rule is:
A readable function name is evidence to verify, not a reason to stop verifying.
For your own modules, use lmvm to inspect whether WinDbg actually loaded a PDB and from where. A function label that comes only from an export table is less informative than a matching private PDB with line and type information.
4. Configure source and executable-image paths
Next, configure the other two maps:
.srcpath C:\Lab\Source\NativeLab
.exepath C:\Lab\Targets\NativeLab\x64\Debug
.srcpath
.exepath
The final two commands display the active paths, giving you a short, reproducible record in the command window.
Source path
A PDB commonly contains the original full path of each source file at build time. That may work on the build machine but fail after you restore a checkpoint, move a project, or analyze an artifact on another VM. The source path gives WinDbg a local place to search when the recorded path is unavailable.
For the course’s targets, build from and preserve the source under:
C:\Lab\Source\NativeLab
The source path does not make source view possible by itself. WinDbg still needs a matching PDB with source-line records. Likewise, public Microsoft symbols generally do not give you Microsoft’s proprietary source files merely because you set a source path. The path is principally for your laboratory code.
Executable-image path
The image path tells WinDbg where to locate an original .exe or .dll file when the debugger does not already have an accessible copy. This becomes particularly valuable for crash dumps: a dump may contain module metadata and selected memory pages but not every byte of every loaded image.
For a live process launched directly from its build directory, WinDbg usually already knows the image location. Set .exepath anyway, because later you will work with dumps, copies of binaries, and experiments whose current directory is not the target directory.
The image path is not the Windows DLL search order. It does not change how the target process loads DLLs, and it does not pin an ASLR base. It is a debugger-side lookup path only.
Microsoft’s custom-application walkthrough uses the same division of responsibility: target PDBs are added to the symbol search path, while source access depends on whether the PDB’s recorded source paths remain valid.
Get Started with WinDbg User-Mode Debugger - Windows drivers
Read the “Open your own application and attach WinDbg” portion of Microsoft Learn’s user-mode tutorial. It is a useful reference for the next lesson, when your first native x64 laboratory build will produce an executable and matching PDB.
In the section “Open your own application and attach WinDbg,” begin at the target layout assumptions. Compare its build-output directory and source-tree assumptions with the paths you created above. Then follow the custom target flow, noting that valid source display depends on matching symbols as well as reachable source files.
5. Validate Microsoft symbols with a native x64 process
Use Notepad only as a harmless validation target. It proves that WinDbg can retrieve and load public Windows symbols; it does not validate your future target’s private PDB yet.
-
In WinDbg, choose File → Launch Executable.
-
Launch:
C:\Windows\System32\notepad.exeOn your native x64 Server guest,
System32is the x64 system directory. Do not accidentally validate a WOW64 executable if the goal is an x64 baseline. -
At WinDbg’s initial break, run:
.reload /f
lmvm ntdll
x ntdll!Rtl*Heap*
!lmi notepad
.reload /f forces WinDbg to retry symbol loading after you changed paths. lmvm ntdll should show that WinDbg loaded public symbols for ntdll; the exact output can vary by OS build. x ntdll!Rtl*Heap* confirms that WinDbg can resolve a family of named routines rather than showing only raw addresses. !lmi notepad displays image information; inspect it to confirm that the test image is x64.
The initial int 3-style breakpoint during process startup is normal. It is WinDbg’s initial debugger break, not a vulnerability and not evidence that Notepad crashed. Use g only when you want execution to continue.
At this point, your target PDB directory is intentionally empty. In the next lesson, you will produce a native x64 target and its PDB. Then your validation sequence becomes:
.reload /f NativeLab.exe
lmvm NativeLab
x NativeLab!*
For the target module, you want to see a matching private symbols status and a PDB path within your controlled laboratory directories. Once source lookup is available, breakpoints and source views should point into C:\Lab\Source\NativeLab, not an abandoned build path.
6. Diagnose configuration failures methodically
When symbols fail, avoid changing several things at once. Diagnose in this order:
| Symptom | Likely cause | Focused response |
|---|---|---|
Target+0x... rather than target function names | Missing, stale, or mismatched target PDB | Confirm the PDB came from the exact target build; inspect lmvm Target. |
| Windows modules lack useful names | Public symbol server unavailable or cache empty | Check the active .sympath; temporarily use approved provisioning connectivity if the required public PDB is not cached. |
| Symbols load, but source does not open | PDB records a source path that no longer exists | Confirm .srcpath includes the actual source-tree root and that the source matches the build. |
| Dump analysis cannot find an image file | The dump does not contain the whole original executable/DLL | Add the directory holding the exact .exe or .dll to .exepath. |
| Symbol loading is unexpectedly slow or unclear | Cache missing, path typo, network issue, or identity mismatch | Enable verbose diagnostics, reload the relevant module, then read the search attempts. |
For the last case, use:
!sym noisy
.reload /f ntdll.dll
!sym noisy exposes the directories, cache entries, and server requests WinDbg considers. This is much more useful than guessing whether the debugger “should have found” a PDB. Record the relevant result in your lab ledger, then disable or ignore the extra output once the problem is understood.
Before ending the session, add these entries to lab-record.md:
Debugger: WinDbg x64, version <recorded version>
Symbol path: <output of .sympath>
Source path: <output of .srcpath>
Executable image path: <output of .exepath>
Microsoft-symbol validation: ntdll public symbols loaded / date
Isolation state after validation: Lab-Private restored
This configuration is part of reproducibility. A future crash report should be able to answer not merely “what crashed?” but also “which target build, which PDB, and which source tree did WinDbg use to interpret it?”
Key takeaways
WinDbg relies on three separate lookup systems: the symbol path for PDBs, the source path for local source files, and the executable-image path for original PE images. Keep private PDBs, Microsoft’s symbol-server cache, source code, and build outputs in separate predictable directories.
For this lab, the core configuration is an explicit symbol path with a local Microsoft cache, plus source and image paths rooted at C:\Lab. Validate public Windows symbols with an x64 system process now; validate private target symbols only after the target is built.
Next, you will build native x64 desktop test targets with deliberate compiler, linker, mitigation, and heap-manifest settings—creating the exact binaries, PDBs, and source relationships this WinDbg configuration is designed to inspect.
Can't find a good explanation? Sign up and we'll make it for you
Sign up