
Hello again. In the previous lesson, you learned where the three main Power BI Desktop views are and located Get data on the Home ribbon. Now you will use that command to bring a de-identified healthcare workbook into your Power BI file.
By the end of this lesson, the workbook’s selected table or worksheet will be loaded into Power BI Desktop, visible in the Data pane, and ready for the first report visuals. The workflow is simple, but two decisions matter: choosing the right object in the workbook and confirming that Power BI loaded what you expected.
Before you import: protect the data and identify the analysis table
For practice, use only a de-identified healthcare workbook. It should not contain direct identifiers such as patient names, addresses, phone numbers, email addresses, medical-record numbers, or full dates of birth.
De-identification reduces risk; it does not automatically make a dataset safe to share publicly. Combinations of fields such as a rare diagnosis, exact date, small department, and location can sometimes still identify a person. For this course, keep the workbook and resulting .pbix file in a private location, and do not publish or send them without permission.
Open the workbook briefly in Excel before importing it. You are not cleaning it yet; simply identify the tab that contains the records you will analyze. A healthcare operations dataset might have columns such as:
- Encounter Date
- Department
- Admission Type
- Length of Stay
- Wait Time
- Discharge Status
- Patient Count or Visit ID
Look for a tab where:
- The first row contains field names.
- Each later row represents one comparable record, such as one encounter, visit, admission, or daily departmental observation.
- There are no decorative titles, subtotal rows, merged cells, or multiple unrelated tables above and below the data.
This is usually your primary analysis table. If the workbook also contains lookup tabs, such as a department list or an information sheet, do not load them automatically just because they are available. Load what you need for the current report; later modules will cover combining and modeling multiple tables deliberately.
See the import workflow once
The Microsoft Learn quickstart gives a concise reference for the connector, Navigator, and post-import verification steps.
Quickstart: Connect to data in Power BI Desktop
Read Microsoft Learn’s “Quickstart: Connect to data in Power BI Desktop” to see the complete Excel import sequence and how loaded fields appear afterward.
In the “Connect to data” section, begin with the connector overview. Then read the remainder of that section, especially the numbered actions beginning with opening Power BI Desktop and ending with selecting Load in Navigator. Continue to the “View data in the Fields pane” section and note how expanding a table reveals its columns. The article uses a financial sample; substitute your healthcare workbook and its table names.
If you would rather see the same sequence performed on screen, this short demonstration is useful. It uses non-healthcare data, but the Power BI interface is the same.
How to Get Excel Data into Power BI Desktop
Watch “How to Get Excel Data into Power BI Desktop” by Power BI Tutorials by MadeEasy for a brief visual walkthrough of selecting an Excel file, choosing workbook objects, loading them, and finding the imported fields.
Watch the import process, focusing on how a checkbox in Navigator controls which object is selected and how the preview changes. Then watch the verification to see where imported tables appear in the Data pane.
Start the Excel connection
Open the blank .pbix file you saved after the previous lesson, or open Power BI Desktop and create a Blank report.
On the Home tab of the ribbon, select Get data. In some Power BI Desktop versions, you may see a separate Excel workbook button next to Get data; selecting that button reaches the same Excel connector more directly.
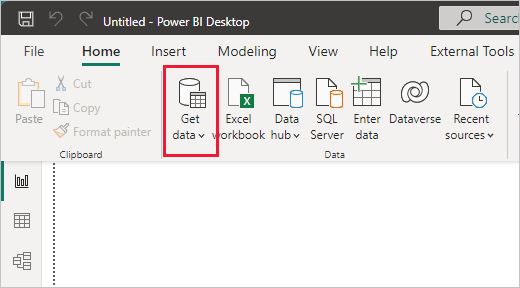
If you selected Get data, the Get Data dialog opens. Choose Excel, then choose Connect. Browse to the location of your de-identified healthcare workbook, select the file, and select Open.
At this point, Power BI is not yet importing the entire workbook. It is reading the workbook’s structure so that you can decide exactly what enters the Power BI model.
A few practical points:
- If the workbook is currently open in Excel, Power BI can often still read it, but closing Excel first avoids confusion about which saved version you imported.
- If you choose the wrong file, cancel from Navigator and repeat the connection. Nothing is loaded until you select Load.
- If Power BI asks about privacy levels, choose the organizational setting that matches the data’s approved use in your environment. Do not treat a privacy prompt as a routine click-through, especially for healthcare-related sources.
Use Navigator to select the correct workbook object
After Power BI reads the file, it opens the Navigator window. The left side lists objects found in the workbook; these may include Excel tables, worksheets, and sometimes named ranges. Select an item on the left to see a preview on the right.
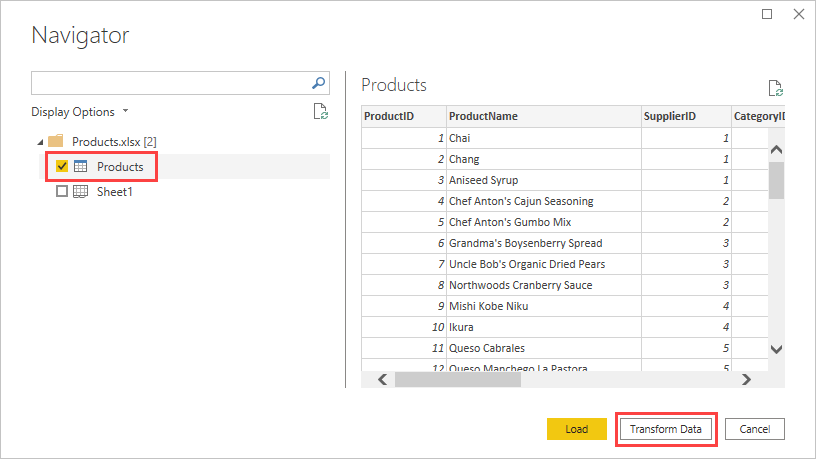
The important distinction is between an Excel table and an Excel worksheet:
- An Excel table is a deliberately structured range with named headers. In Navigator, it commonly has a table/grid icon. When a suitable table exists, it is usually the safer choice.
- A worksheet is the whole Excel tab. Importing it can be appropriate, but it may include title rows, empty columns, notes, subtotals, or more than one block of data.
Suppose your workbook lists both Encounters and Sheet1. If Encounters is a table and its preview has one header row plus encounter records beneath it, select Encounters, not Sheet1. The object name matters less than the preview: confirm that the fields and records match the data you examined in Excel.
Read the preview like a quality check
Before choosing anything, inspect the Navigator preview deliberately:
- Column names: Are the visible headers meaningful, such as
Department,Encounter Date, orWait Time? Generic headings such asColumn1often mean the wrong range or worksheet was selected. - Rows: Do the first several rows look like genuine records rather than report titles, notes, or totals?
- Fields needed soon: For the next few lessons, you will need at least one categorical field, such as Department or Admission Type; one numeric measure, such as Wait Time or Length of Stay; and one date field for a trend.
- Number of objects: Check only the primary table needed for this first report unless your dataset instructions explicitly identify additional related tables.
Checking an object’s box is what marks it for import. Clicking its name alone may show a preview, but it does not necessarily select it. Make sure the checkbox beside your intended table is checked.
Choose Load or Transform Data
Navigator offers two useful options at the lower right:
| Choice | What happens now | Use it when |
|---|---|---|
| Load | Imports the selected data into the Power BI model immediately. | The table looks structurally ready for this first report and you want to start building visuals. |
| Transform Data | Opens Power Query Editor before the data is loaded into the report model. | You already see problems that must be fixed first, such as title rows, incorrect headers, invalid dates, or irrelevant columns. |
For this lesson, select Load if the preview has sensible headers and usable rows. Power BI will show a loading status while it imports the selected object. When the process finishes, you return to Report view.
Do not interpret Load as permanently accepting the data exactly as it is. You can open Transform data later from the Home ribbon, and the next module focuses on inspecting, cleaning, and reshaping imported healthcare data in Power Query.
Confirm that the import succeeded
An empty report canvas after loading does not mean the import failed. Loading data creates tables in the model; it does not automatically place a visual on the report page.
First, look to the right-side Data pane, called the Fields pane in some older tutorials. You should see the imported table listed by name. Expand it to see its columns.
Then switch to Data view using the table/grid icon on the left. Select the imported table if necessary and inspect the grid. You are validating the import, not correcting errors yet.
Use this quick verification checklist:
- One expected table appears in the Data pane, with the correct name or a recognizable name.
- Expected columns appear, including your category, numeric, and date fields.
- Headers are headers, not a row of data. If
Column1,Column2, and similar labels appear unexpectedly, stop before building visuals; the selected object may need cleaning in Power Query. - Rows look plausible. A row should represent the kind of observation you expect, such as an encounter or departmental record.
- Sensitive fields are absent. If direct identifiers unexpectedly appear, do not proceed with report sharing. Consult the dataset owner or your organization’s process before continuing.
Finally, save the file with a clear name, for example:
Healthcare_Operations_Starter.pbix
The .pbix file stores your report, model, and—when using the normal Import mode for Excel—the imported data. It is therefore potentially sensitive even when the source file has been de-identified.
If something looks wrong
Most import issues at this stage have a simple cause:
| Symptom | Likely cause | First response |
|---|---|---|
| No preview appears | You clicked an object name but did not select it, or the file structure is unusual. | Select a different workbook object and inspect its preview. |
Headers say Column1, Column2 | The worksheet has title rows or the wrong range was selected. | Choose a structured Excel table if available; otherwise use Transform Data later to promote proper headers. |
| Too many irrelevant columns or rows | The full worksheet includes notes or unused cells. | Prefer the actual Excel table, or plan to filter and remove columns in Power Query. |
| Table is missing after Load | The object was not checked in Navigator or loading was canceled. | Repeat the connection and verify the checkbox before selecting Load. |
At this stage, resist the temptation to repair every issue manually in the Data view. In Power BI, repeatable preparation belongs in Power Query, where the cleaning steps can be documented and rerun when the source changes.
Key takeaways
You have now completed Power BI Desktop’s basic Excel import workflow:
- Start from Home and select the Excel connector.
- Browse to the de-identified healthcare workbook.
- In Navigator, select the appropriate table or worksheet based on its preview.
- Choose Load when the structure is ready enough to report on; use Transform Data when preparation must happen first.
- Verify the result in the Data pane and Data view, then save the
.pbixfile securely.
Your next lesson uses this imported data to create a bar chart comparing a healthcare measure across categories.
Can't find a good explanation? Sign up and we'll make it for you
Sign up