
Hello again. In the previous lesson, you built a metric tree that connected an analytical output to an operational action and a financial outcome. That work supplies the evidence for the first question in prioritization: which use cases could create meaningful value?
But a valuable idea is not automatically the best next investment. A demand-forecasting initiative may promise substantial value yet depend on fragmented data and a six-month systems integration. A smaller workflow assistant may deliver a measurable result in weeks and establish reusable capabilities. This lesson gives you a defensible way to compare such choices using value, feasibility, and risk—and to explain why the top-ranked item is the right next move, rather than merely the most exciting idea.
Prioritization is a portfolio decision, not an idea contest
Analytics backlogs often contain incomparable requests:
- “Build a churn model.”
- “Use GenAI to improve employee productivity.”
- “Forecast demand more accurately.”
- “Create a management dashboard.”
- “Automate claims triage.”
These are not use cases yet. Before scoring, each needs the decision-centred definition developed earlier:
A named user makes a specific decision, for a defined unit of analysis and time horizon, using an analytical product.
For example:
Each morning, regional inventory planners use a weekly SKU-location demand forecast to decide replenishment quantities for the next ordering cycle.
That statement makes it possible to assess value, feasibility, and risk consistently. “Improve forecasting” is too vague to score; “support replenishment decisions for SKU-location pairs every Monday” is concrete enough to investigate.
A prioritization process should answer four management questions:
- What is worth pursuing?
- What can realistically be delivered and adopted?
- What risks must be controlled or make the idea unacceptable?
- What should be built now, researched, sequenced behind foundations, or deliberately deferred?
The aim is not to create a mathematically perfect ranking. It is to make assumptions visible, compare options fairly, and direct scarce team capacity toward a coherent portfolio.
Start with gates: some conditions are not trade-offs
A score should not allow a use case with an unacceptable privacy problem to “win” because it promises high revenue. Before scoring, apply a small set of must-pass gates.
| Gate | Question | If it fails |
|---|---|---|
| Decision ownership | Is there a named business owner who will act on the output and be accountable for outcomes? | Defer or identify an owner; do not build an orphaned model. |
| Data readiness | Are the required data accessible, lawful to use, sufficiently reliable, and available at the needed cadence? | Create a data-foundation initiative or defer the use case. |
| Privacy, security, and ethics | Can the proposed use comply with applicable privacy, security, and responsible-AI requirements? | Redesign the scope, add controls, or halt it. |
| Operational control | Can users act safely within capacity, policy, and workflow constraints? | Redesign the intervention or add process controls. |
For German and European employers, privacy and governance deserve particular attention. A use case involving employee data, health data, credit decisions, or individual-level profiling may require a much more demanding review than an aggregate demand forecast. “We can technically access the data” is not evidence that the use is appropriate or permitted.
A gate failure does not necessarily mean that an idea has no value. It may reveal a prerequisite. For instance, if several attractive use cases depend on unreliable product master data, “improve product master-data quality” may become a foundation investment before the analytics initiatives begin.
AI Use-Case Prioritization Framework: Digital Tech
Read Umbrex’s framework to see a practical distinction between scoring dimensions, must-pass checks, and portfolio sequencing. Focus on the discipline of treating data readiness, decision ownership, and compliance as gates rather than letting them disappear inside an attractive overall score.
First, read the criteria list beginning with the evaluation dimensions. Notice that feasibility includes operational adoption and integration, not only model development. Then find the subsection “Gating conditions (‘must-pass’ checks)” and read the must pass checks. Finally, in “Portfolio balance and sequencing,” read the portfolio sequencing guidance, especially the treatment of shared data and platform dependencies.
The three scoring dimensions
After use cases pass the gates, score them against three dimensions on a shared scale. A five-point scale is usually detailed enough to distinguish options while avoiding false precision.
1. Value: how much does a successful use case matter?
Value should come from the metric tree or value bridge developed in the previous lesson. It can include financial impact, service improvement, risk reduction, or strategic enablement—but the evidence should be explicit.
A useful value score considers:
- expected improvement in a business KPI;
- estimated financial impact or cost avoided;
- strategic relevance, such as a required customer promise or regulatory objective;
- breadth of the affected population or process;
- whether the use case unlocks reusable data products, features, or workflow patterns.
Use a conservative or base-case estimate, not the most optimistic scenario in the business case. Record uncertainty separately. A forecast expected to reduce inventory by EUR 2 million in a credible base case deserves a stronger score than an untested claim of EUR 10 million upside.
2. Feasibility: can the organisation deliver and use it?
Feasibility is broader than whether a data scientist can train a model. It includes the full route from data to a changed decision:
- data accessibility, quality, history, and refresh cadence;
- analytical difficulty and availability of required skills;
- integration with operational systems and reporting tools;
- delivery time and delivery-team capacity;
- workflow change, training, and user adoption;
- ability to measure outcomes against a baseline.
A technically simple model can still be low-feasibility if it requires a difficult ERP integration or a frontline workflow redesign. Conversely, a moderately sophisticated model may be feasible if it uses established data, a familiar cloud environment, and a team already able to act on its output.
3. Risk: what could go wrong despite planned controls?
Risk should cover more than the chance that a model performs poorly. Typical categories include:
- privacy and security risk: inappropriate access, sensitive-data exposure, weak access controls;
- fairness and harm risk: unequal treatment, denial of a beneficial intervention, exclusion of a vulnerable group;
- model and decision risk: poor calibration, drift, automation bias, or misuse outside intended scope;
- operational risk: disruption, unsafe recommendations, capacity overload, or failure at a critical time;
- legal and reputational risk: non-compliance, customer harm, or loss of trust.
Score residual risk: the risk that remains after realistic controls are in place. A high-risk use case is not automatically rejected. It may deserve a limited pilot, human review, monitoring, or executive approval. However, an unacceptable risk remains a gate failure, not a number to be offset by high projected value.
Use anchored rubrics, not intuition alone
A score of “4” means little unless everyone uses it consistently. Create short descriptors for each level before scoring the portfolio.
| Score | Value | Feasibility | Residual risk |
|---|---|---|---|
| 1 | Local or weakly evidenced benefit; little connection to priority outcomes | Major data, technical, workflow, or integration obstacles | Low; standard controls are sufficient |
| 2 | Limited benefit or uncertain business case | Material gaps require significant discovery or enabling work | Some identifiable concerns, largely manageable |
| 3 | Material KPI improvement with a plausible value bridge | A pilot is realistic, but notable data, integration, or adoption work remains | Meaningful risk requiring defined mitigation and monitoring |
| 4 | Strong, quantified contribution to a priority outcome | Data and ownership are established; delivery path is clear | Elevated risk, but controls and accountable oversight are credible |
| 5 | Large, strategically important, finance-validated value potential | Existing capabilities enable a near-term pilot or rollout | High residual exposure requiring senior approval, strict boundaries, or extensive controls |
The risk column is intentionally oriented differently: a higher risk score is worse. Make this unmistakable in the worksheet; otherwise, teams often accidentally reward risk with a higher number.
For an important risk category, avoid averaging away a serious concern. If privacy risk is 1, model risk is 2, but fairness risk is 5, the use case should be treated as risk level 5 for governance purposes. A single severe exposure deserves focused attention.
Actionability: the missing ingredient in many “feasible” projects
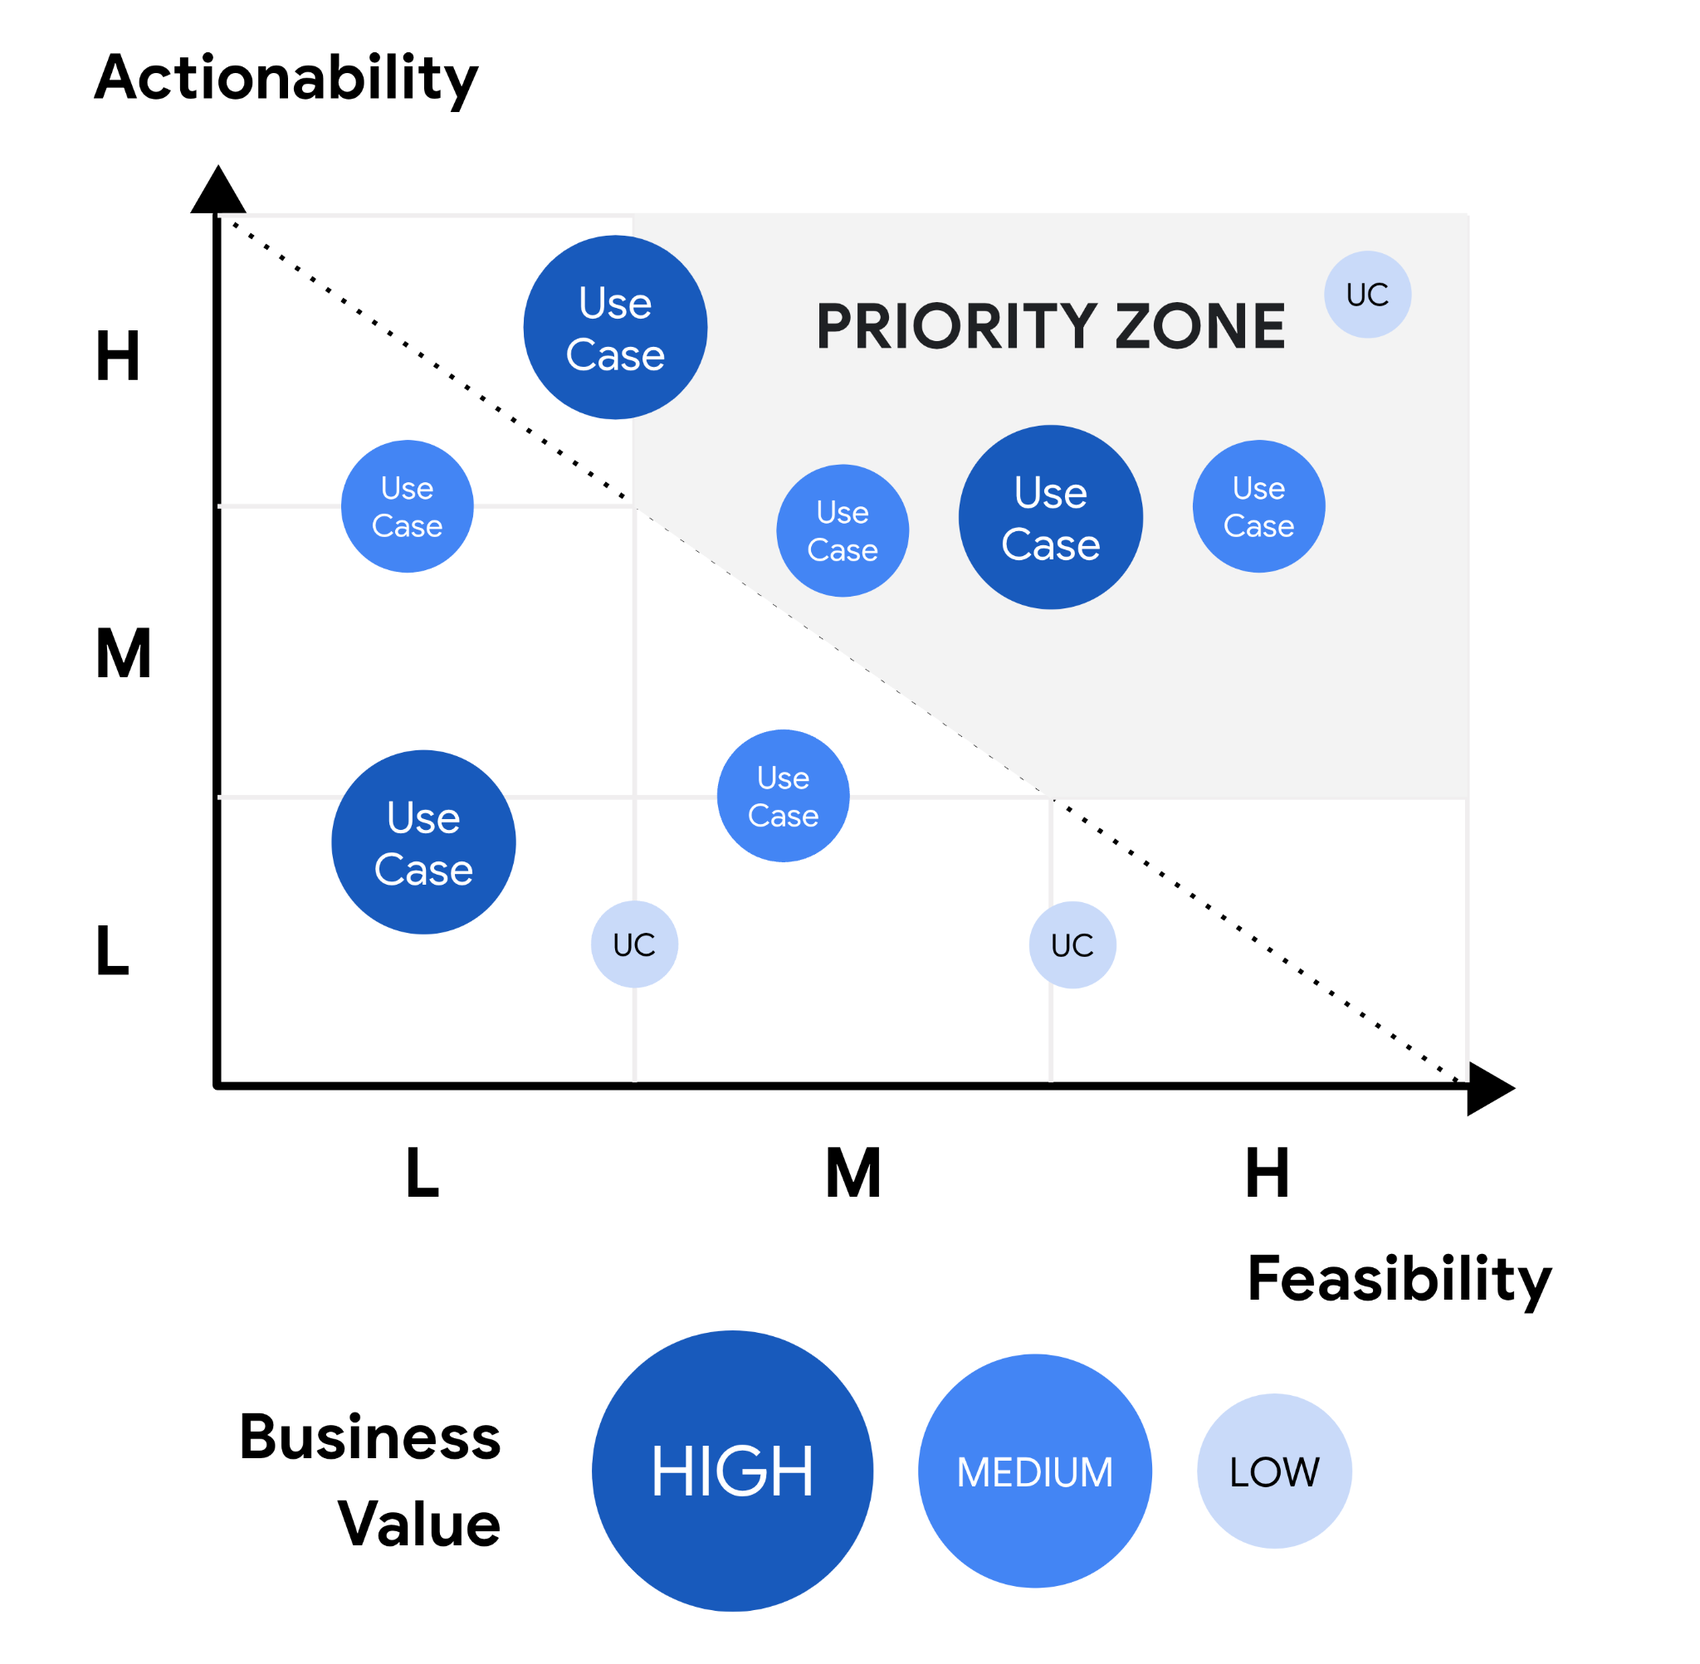
The prioritization image below uses feasibility on the horizontal axis and actionability on the vertical axis. Bubble size represents business value.
Actionability asks a practical question:
If we deliver the analysis tomorrow, can a user make a better decision with it?
It depends on more than having a named sponsor. A recommendation is actionable when:
- the user has authority to act;
- the action fits within operational capacity;
- the output arrives in time for the decision;
- the recommendation is understandable and trustworthy enough to use;
- users have incentives and training to change the current process.
For a compact scoring model, treat actionability as a major component of feasibility. For a larger portfolio, score it separately as the image does, because it often exposes an important distinction:
- A technically easy dashboard may be feasible but not actionable if nobody owns the associated decision.
- A valuable predictive model may be technically feasible but operationally weak if users lack capacity to respond.
- A simpler prioritised queue may be highly actionable because it fits directly into a daily workflow.
This is a useful leadership insight: a modest model embedded in a real decision process often creates more value than an advanced model that remains outside the workflow.
Calculate a transparent priority score
A weighted score provides an initial ranking, provided it is not treated as an automatic investment decision. For a portfolio where near-term value matters, use the following example:
where:
- is the value score from 1 to 5;
- is the feasibility score from 1 to 5;
- is the residual-risk score from 1 to 5.
This formula reverses the risk scale through , so lower residual risk contributes positively. The weights reflect a strategic choice: value matters most, feasibility is next, and risk remains material. They are not universal. A regulated organisation may give risk a greater weight; a turnaround situation may put more weight on time-to-value.
Consider four illustrative use cases after gating:
| Use case | Value | Feasibility | Risk | Priority score | Initial interpretation |
|---|---|---|---|---|---|
| Targeted appointment outreach | 4 | 4 | 3 | 3.80 | Strong pilot candidate |
| Demand sensing for replenishment | 5 | 2 | 3 | 3.55 | High-value strategic bet; investigate dependencies |
| Internal policy knowledge assistant | 3 | 5 | 2 | 3.90 | Fast, lower-risk candidate with bounded value |
| Dynamic individual pricing | 5 | 2 | 5 | 3.15 | High potential, but high-risk and difficult; likely defer or tightly research |
The knowledge assistant ranks first numerically, but that does not mean it should receive most of the year’s investment. It may be a quick win that builds delivery credibility, while demand sensing remains the larger strategic bet. A good portfolio can include both, as long as the team is explicit about their distinct roles.
The score is most useful when accompanied by its evidence:
| Dimension | Evidence for targeted appointment outreach |
|---|---|
| Value | Metric tree estimates incremental contribution from recovered appointments; finance validates the contribution assumption. |
| Feasibility | Appointment, outreach, and attendance data exist; workflow has a daily capacity of 200 calls; a scheduling-system integration remains. |
| Risk | Uses sensitive personal data; access controls, communication preferences, fairness checks, and human review are required. |
| Key uncertainty | The causal uplift from outreach must be tested against the current workflow. |
This prevents a workshop participant from assigning a “4” merely because they like the idea.
Visualise the scores, then make a management decision
A weighted ranking is useful for comparison, but a two-dimensional portfolio map is often easier to discuss with executives:
- Horizontal axis: feasibility, from low to high;
- Vertical axis: business value, from low to high;
- Bubble size: estimated annual value or affected population;
- Bubble colour: residual risk, such as green, amber, or red.
Interpret the map as a set of management actions:
| Portfolio position | Typical decision |
|---|---|
| High value, high feasibility, manageable risk | Accelerate to a pilot or minimum viable product. |
| High value, low feasibility | Research, fund a prerequisite, or sequence after data and platform foundations. |
| Low value, high feasibility | Consider a tightly scoped quick win; cap investment so it does not displace major opportunities. |
| Low value, low feasibility | Defer, shelve, or revisit only if conditions change. |
| High residual risk in any position | Add controls, restrict the scope, obtain appropriate approval, or stop. |
The map and score should be used together. The map preserves strategic context; the score makes the trade-offs inspectable.
Run the scoring process as a structured workshop
For a small analytics team, a lightweight process can be completed in a focused cross-functional session.
-
Create one use-case card per candidate. Include the decision, user, KPI, value hypothesis, data sources, integration point, owner, and key risks.
-
Apply gates first. Label failed ideas as “defer,” “redesign,” or “foundation required.” Do not blend them into the ranked backlog.
-
Score independently before discussing. Finance, operations, data, security, and product stakeholders should first give their own evidence-based scores. This reduces the influence of the most senior or loudest person in the room.
-
Calibrate disagreements. A gap between feasibility scores may reveal that engineering knows of an integration problem that business stakeholders have not considered. A gap in value scores may expose incompatible assumptions about marginal cost or demand.
-
Calculate the score and create the portfolio map. Keep the underlying values visible rather than sharing only a rank order.
-
Choose a balanced sequence. Combine a near-term proof point with one or two foundation investments and, where appropriate, a carefully bounded strategic bet.
-
Document the decision and refresh it. Re-score quarterly or when new evidence changes the outlook: a data-quality improvement may raise feasibility; a pilot may validate value; a regulatory change may increase risk.
Do not hide uncertainty in a single number. Add a confidence label—high, medium, or low—to the value estimate, and identify the one or two assumptions that must be tested first. This gives the team a concrete discovery plan rather than a speculative business case.
A practical leadership narrative
In an interview or stakeholder review, avoid saying:
“We ranked our use cases based on impact and effort.”
A stronger explanation is:
“We first screened each use case for a decision owner, data readiness, and non-negotiable governance constraints. We then scored the remaining opportunities using an anchored rubric for value, end-to-end feasibility, and residual risk. We used a weighted score for transparency and a value-feasibility portfolio map for executive discussion. The outcome was a balanced roadmap: one quick win, one data foundation, and one higher-value initiative piloted with explicit risk controls.”
That answer demonstrates that analytics prioritization is not just backlog grooming. It is a disciplined investment and operating-model decision.
Key takeaways
A robust use-case prioritization process makes three distinctions clear:
- Value asks whether a successful use case materially improves a business, operational, or strategic outcome.
- Feasibility asks whether data, technology, workflow, integration, and adoption make delivery realistic.
- Risk asks what harm or exposure remains after credible controls; unacceptable risks are gates, not trade-offs.
- Actionability is essential: the output must reach someone who can make a timely, practical decision.
- Use an anchored 1–5 rubric, evidence for each score, and transparent weights to reduce stakeholder bias.
- Treat the overall score as a conversation aid, not an automatic decision rule.
- Build a balanced portfolio of quick wins, enabling foundations, and carefully managed strategic bets.
Next, you will examine the constraints that sit behind these scores in more detail: data availability and latency, privacy requirements, and fairness considerations that can shape an analytics use case before modelling begins.
Can't find a good explanation? Sign up and we'll make it for you
Sign up