
Hello. You have now established two essentials: a validated organic lead event and a segmentation view by service, location, country, and landing page. This final lesson in the measurement module turns that working analysis into a single stakeholder-ready baseline scorecard.
The purpose is not to build an elaborate dashboard. It is to produce one page that answers, quickly and credibly: How visible is the site in Google Search, how much organic demand reaches the site, how many recorded leads result, where is performance concentrated, and what should be investigated first? This scorecard can become the opening evidence slide in your Marketing Manager portfolio case study.
Plan for about 35–40 minutes. If you only have 30 minutes today, build the scorecard with the required KPI row and three findings; add the trend and polish in the next session.
1. Treat the scorecard as a decision document, not a metric collection
A baseline is a documented starting point against which later work can be assessed. It is not a claim that every number is good or bad. Its value comes from making the current situation clear enough that a manager can decide where attention should go.
For this service business, the scorecard should tell one connected story:
- Search visibility: How often does the site appear, and how often do people click?
- Organic acquisition: How many Organic Search sessions arrive on the site?
- Lead outcome: How many validated lead events occur, and at what rate?
- Concentration and opportunity: Which pages, services, locations, or markets meaningfully influence those results?
The information hierarchy matters. A stakeholder should be able to read the headline figures in under a minute, then use the segment table and your commentary to understand what deserves action.
Google Search Console and GA4 have distinct jobs in this story:
| Question | Primary source | Metrics |
|---|---|---|
| Did the site appear in Google Search? | Google Search Console | Impressions, clicks, CTR, average position |
| Did organic visitors reach and use the site? | GA4 | Organic sessions, engagement metrics where relevant |
| Did organic visits produce recorded leads? | GA4 | Validated generate_lead events and organic session lead rate |
Do not attempt to make Search Console clicks equal GA4 sessions. As established in the previous lesson, they are related measures with different collection and reporting rules. Presenting both is a strength when they are clearly labelled.
Read the relevant official Search Console guidance before extracting your data.
Performance report (Search results) - Search Console Help
Google’s Search Console Help explains the meaning of the core visibility metrics and an important limitation when exporting report tables. This will help you avoid presenting a page-level total as though it were a property-level total.
In “Configuring the report,” read the metric and dimension guidance. Focus on the definitions of clicks, impressions, CTR, and average position, and on the difference between the Pages and Countries dimensions. Then go to “Reading the table” and “Sharing and exporting data.” Read the aggregation and export notes. In particular, note that query and country data are aggregated by property, while page data are aggregated by page. Do not sum a limited page export and label it “total site performance.”
2. Fix the scorecard’s reporting contract
A polished visual cannot rescue an inconsistent analysis scope. Before placing any numbers, create a small methodology note. Put a shortened version in the scorecard footer and preserve the full version in your working spreadsheet.
Use the same scope from the previous lessons:
| Item | Scorecard specification |
|---|---|
| Current period | Last 90 complete days, using exact start and end dates |
| Comparison period | Immediately preceding 90 complete days |
| Search Console scope | Correct verified property; Search type = Web |
| Analytics scope | GA4 property; Session default channel group = Organic Search |
| Conversion event | The validated generate_lead event from Lesson 2 |
| Geographic terminology | Searcher country is distinct from physical location and site market version |
| Data extraction date | Date on which the reports were pulled |
| Currency or revenue | Omit unless reliably connected to leads or CRM data |
Select six headline KPIs
For a lead-generation SEO baseline, these six cards are sufficient:
| Scorecard area | KPI | Why it belongs |
|---|---|---|
| Search visibility | GSC impressions | Indicates the site’s exposure in Google Search |
| Search acquisition | GSC clicks | Measures visits initiated from Google Search results |
| Search efficiency | GSC CTR | Indicates how effectively impressions turn into clicks |
| On-site acquisition | GA4 organic sessions | Measures recorded Organic Search traffic on the site |
| Business outcome | Recorded organic leads | Connects SEO activity to the validated lead event |
| Outcome efficiency | Organic session lead rate | Shows recorded lead yield relative to organic sessions |
Calculate the final KPI as a rate from the total period values:
Use the label recorded leads rather than “qualified leads” unless CRM or sales data confirms qualification. A form submission can be commercially valuable without necessarily becoming a sales-qualified opportunity.
Handle period comparisons carefully
For count and rate metrics, you can show a percentage change against the immediately previous equivalent period:
If the previous value is zero, show n/a rather than an infinite percentage increase. If seasonality is substantial, add a short caveat in your notes; a 90-day comparison is useful, but it is not proof of causation.
Average position is useful as a diagnostic, but it should not displace your six core cards. If you include it, place it in a small diagnostic note or page-level table. Remember that a lower average-position number represents a higher average ranking. Do not call a change in average position a site-wide ranking improvement without checking the relevant queries and pages.
3. Build the one-page layout
A dashboard can be visually appealing while failing to say what matters. The generic SEO dashboard below illustrates common visual components: summary KPI cards, a trend view, and segment-level charts. For this baseline, use the principle of visual hierarchy but make the page narrower in scope: organic search and lead generation only.
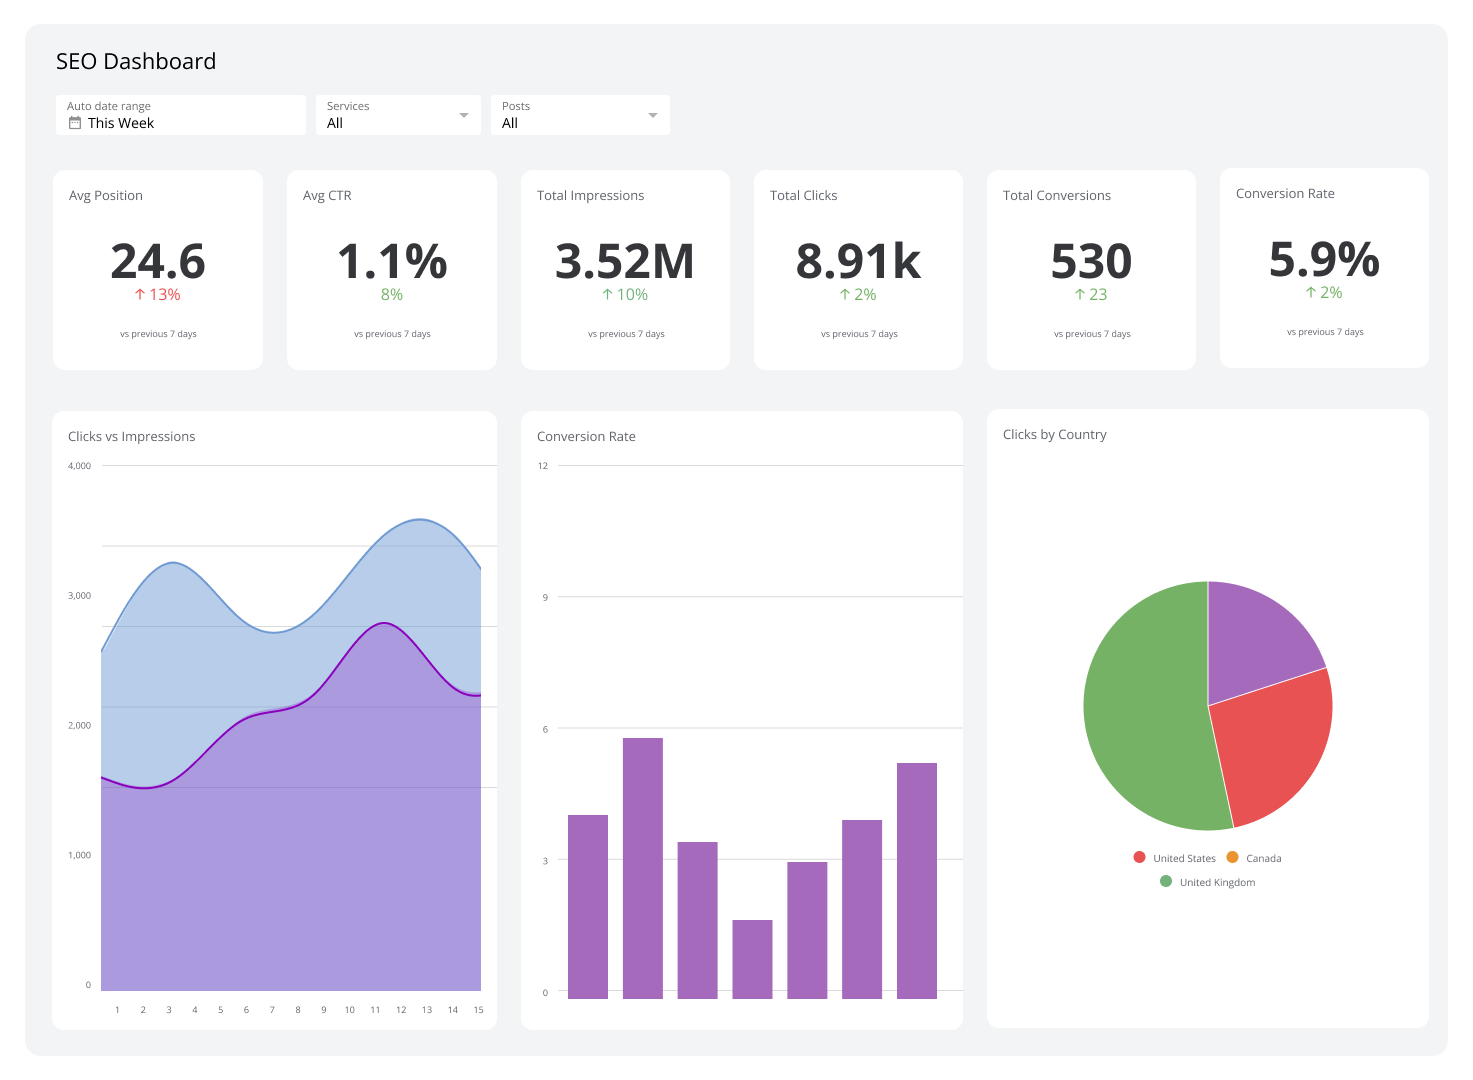
You may build the page in Google Slides, Google Sheets, Looker Studio, or a presentation tool. For a portfolio case study, a slide or one-page PDF is often easiest to review in an interview. What matters is that the data can be reproduced from your saved exports.
Watch this short implementation example if you want to use Looker Studio. The video demonstrates how scorecards can use Search Console for visibility metrics and GA4, filtered to Organic Search, for traffic and conversion metrics.
Visualize Your SEO Data with FREE tool (Looker Studio) | Build SEO Dashboards
In “Visualize Your SEO Data with FREE tool (Looker Studio) | Build SEO Dashboards,” Grace Leung demonstrates a practical SEO performance overview. Watch for the separation between Search Console and GA4 sources, rather than trying to blend their raw values into one metric.
Watch the performance overview. Focus on the KPI choices, period comparisons, and the Organic Search filter applied to GA4 traffic and conversion metrics. The video builds a reusable dashboard; for this lesson, create only one concise baseline page.
Recommended page structure
Use this layout as a specification rather than a rigid design:
| Section | Content | Purpose |
|---|---|---|
| Header | “SEO Lead-Generation Baseline,” current-period dates, comparison dates, and website or market scope | Makes the time frame and scope immediately clear |
| KPI row | The six headline KPI cards, each showing current value and comparison change | Communicates scale and direction at a glance |
| Trend panel | A weekly trend for organic sessions, GSC clicks, or recorded leads | Shows whether the period contains a sustained change or a short-lived spike |
| Segment panel | Three to five decision-relevant rows from your segmentation summary | Shows where performance is concentrated |
| Insights panel | Three evidence-led findings, each paired with a next action | Converts reporting into management direction |
| Footer | Sources, filters, lead definition, extraction date, and major limitations | Makes the document trustworthy and reusable |
Avoid adding metrics simply because a tool makes them available. For this baseline, leave out backlink totals, keyword counts, Core Web Vitals, and local review metrics unless one of them is essential to explain a material result. Those topics will be evaluated properly in later modules.
Keep the visual language honest
Use restrained formatting:
- Use one neutral color for Search Console visibility metrics and a second for GA4 traffic and lead metrics.
- Show growth and decline with words or carefully labelled colors, never color alone.
- Label every metric with its source: GSC or GA4.
- Use whole numbers for impressions, clicks, sessions, and leads. Use one decimal place at most for CTR and lead rate.
- Prefer a simple table over a pie chart for a small number of services, locations, or countries.
- Do not use a dual-axis chart unless both axes are clearly labelled and genuinely aid interpretation.
4. Extract, reconcile, and place the evidence
Build the scorecard from saved exports, not from memory or manually copied fragments. Create a workbook with at least two tabs: Raw exports and Scorecard calculations. Keep the earlier page taxonomy and segmentation summary available.
Extract the Search Console KPI values
In Search Console > Performance > Search results:
- Set the exact current 90-day date range.
- Confirm Search type: Web.
- Turn on clicks, impressions, CTR, and average position.
- Add an equal-length comparison period if the interface permits it.
- Record or export the property-level headline values for impressions, clicks, and CTR.
- Save a screenshot or exported report with the date settings visible.
Use property-level headline totals for the KPI cards. Use the Pages, Countries, and Queries tabs for supporting explanation only.
Extract the GA4 KPI values
In GA4, use a report or Exploration where the scope is explicitly:
Session default channel group exactly matches Organic Search
Record:
- Organic sessions
- Recorded
generate_leadevents - Organic session lead rate, calculated from the exported totals if necessary
Then cross-check the most valuable landing pages against the organic landing-page data from the prior lesson. A scorecard total should agree with its own GA4 report scope, but it does not need to reconcile exactly with Search Console clicks.
Populate the segment panel from your prior analysis
Do not reproduce every segment. Select the rows that change a decision. A useful structure is:
| Segment | Visibility or traffic evidence | Lead evidence | Interpretation |
|---|---|---|---|
| Highest-value service group | GSC clicks and GA4 sessions | Recorded leads and lead rate | Protect and grow |
| Priority service with low exposure | High-value page but low impressions or clicks | Strong or promising lead rate | Investigate keyword and ranking opportunity |
| Underperforming location or market | Weak CTR, sessions, or leads | Low volume or weak rate | Diagnose intent, market fit, and page quality |
| Important landing page | Page-level GSC and GA4 evidence | Lead contribution | Prioritize page improvement or preservation |
A segment can appear because it is successful, because it is strategically important but weak, or because its performance is unusual enough to warrant investigation. State which reason applies.
Write no more than three decision notes
Each note should contain four elements:
- Observation: the factual pattern.
- Evidence: the precise numbers and period.
- Interpretation: a cautious explanation or hypothesis.
- Next action: the analysis or intervention that follows.
Use this format:
Opportunity — [service or page]. The page group generated [X] organic sessions and [Y] recorded leads, producing a [Z%] recorded lead rate, but received only [N] Search Console impressions in the period. This suggests strong commercial fit with limited current search exposure. Next action: assess keyword demand, competitor coverage, and current rankings for this service.
And this one for a possible problem:
Investigate — [location or market]. The [location] page group received [X] impressions but had a [Y%] CTR, below the comparable [market] group’s [Z%] CTR. This may reflect rank, result-page features, or mismatched local intent; it is not yet evidence of a content problem. Next action: inspect the leading queries and live results for that market.
This phrasing is especially useful in an interview setting: it demonstrates that you can distinguish a measured fact from a proposed explanation.
5. Your finished scorecard template
Use the following as the content specification for your page. Replace bracketed text with your site’s actual data.
SEO Lead-Generation Baseline
Current period: [DD Month YYYY to DD Month YYYY]
Compared with: [previous equal-length period]
Scope: Google Search Web results and GA4 Organic Search sessions
| GSC impressions | GSC clicks | GSC CTR | GA4 organic sessions | Recorded organic leads | Organic session lead rate |
|---|---|---|---|---|---|
| [value] | [value] | [value%] | [value] | [value] | [value%] |
| [comparison change] | [comparison change] | [comparison change] | [comparison change] | [comparison change] | [comparison change] |
Organic performance trend:
[Insert one clearly labelled weekly chart. Use either GSC clicks, GA4 organic sessions, or recorded organic leads. Include the precise period.]
| Priority segment | GSC evidence | GA4 evidence | Decision |
|---|---|---|---|
| [Service, location, country, or page] | [Impressions, clicks, CTR] | [Sessions, leads, lead rate] | [Protect, grow, or investigate] |
| [Service, location, country, or page] | [Impressions, clicks, CTR] | [Sessions, leads, lead rate] | [Protect, grow, or investigate] |
| [Service, location, country, or page] | [Impressions, clicks, CTR] | [Sessions, leads, lead rate] | [Protect, grow, or investigate] |
Three findings and next actions
- [Finding title]: [Evidence-based observation.] Next action: [specific analysis or intervention].
- [Finding title]: [Evidence-based observation.] Next action: [specific analysis or intervention].
- [Finding title]: [Evidence-based observation.] Next action: [specific analysis or intervention].
Method and limitations: GSC property: [property]. Search type: Web. GA4 filter: Session default channel group = Organic Search. Lead definition: validated generate_lead. GSC clicks and GA4 sessions are not expected to match exactly. [Add low-volume, consent, seasonality, taxonomy, or tracking limitations that materially affect interpretation.]
Before calling the scorecard complete, apply this quality check:
- Every KPI has a stated source and exact date range.
- The GA4 cards use an Organic Search session filter.
- The lead metric matches the event you validated earlier.
- Comparisons use equal time periods.
- Searcher country, physical location, and market version are not conflated.
- There are no unsupported causal claims.
- The page has three or fewer decision notes, each with a next action.
- A stakeholder could understand what to do next without opening either analytics platform.
Key takeaways
A useful SEO baseline scorecard is selective, traceable, and decision-oriented.
- Use Search Console for visibility and clicks, and GA4 for organic sessions and recorded leads.
- Keep six headline KPIs: impressions, clicks, CTR, organic sessions, recorded leads, and organic session lead rate.
- Preserve consistent dates, filters, and lead definitions so later performance comparisons are meaningful.
- Use the segmentation work from the prior lesson to show where results are concentrated and where opportunity may exist.
- Pair every material finding with a precise next action and clearly state limitations.
You have now completed the measurement baseline for the site. The next module moves from “what is happening?” to “where can the business realistically win?” You will identify the site’s true organic competitors in priority target markets using Ahrefs or Semrush keyword-overlap data.
Can't find a good explanation? Sign up and we'll make it for you
Sign up