
Hello! Welcome back to our course on deflation.
In our first lesson, we explored the anatomy of Japan's massive asset price bubble in the late 1980s, setting the stage for the economic turmoil that followed. We saw how a combination of international pressure (the Plaza Accord), aggressive domestic monetary easing, and widespread speculative euphoria created one of the largest financial bubbles in modern history.
Introduction
Today's lesson directly follows the bursting of that bubble. We will address the learning outcome: "Chart the timeline of Japan's deflation from 1990 to the present, identifying distinct phases using core CPI and real GDP growth data."
We will trace the path of the Japanese economy from the initial crash through decades of falling prices and economic stagnation. Our goal is to build a clear chronological map, breaking down this long period into distinct phases, each with its own characteristics and challenges. This timeline will serve as the fundamental framework for the rest of our case study.
- Estimated time to complete: 60 minutes.
- Recap: We concluded the last lesson at the peak of the bubble in 1989. The Bank of Japan, under a new governor, had begun to raise interest rates to "prick the bubble," setting in motion a collapse in asset prices and exposing the immense debt and malinvestment that had built up.
1. The Bubble Bursts: Disinflation and Recession (Early 1990s)
The end of the bubble was not a single event but a rapid, sustained collapse. The Nikkei stock index peaked in December 1989 and began a steep decline. Land prices followed shortly after. This destruction of wealth triggered a sharp economic slowdown.
However, the economy did not immediately plunge into deflation. The initial phase was one of disinflation—a slowing of the rate of price increases.
For a precise academic description of this initial period, let's turn to a paper from the Bank for International Settlements (BIS).
Reading (5 minutes):
Please read the following sections from Japan's deflation, problems in the financial system and ... (Japan’s deflation, problems in the financial system and monetary policy; 1.1 Japan’s deflation since the 1990s). Focus on the authors' description of the macroeconomic experience post-1991 and their specific dating of when the CPI and GDP deflator began to fall.
The authors note that while the economy began to stagnate in the early 1990s, the GDP deflator only began its consistent decline in 1995, and the Consumer Price Index (CPI) followed in 1998. This lag is crucial.
Let's visualize this period using the key data from our learning outcome: real GDP growth and CPI.
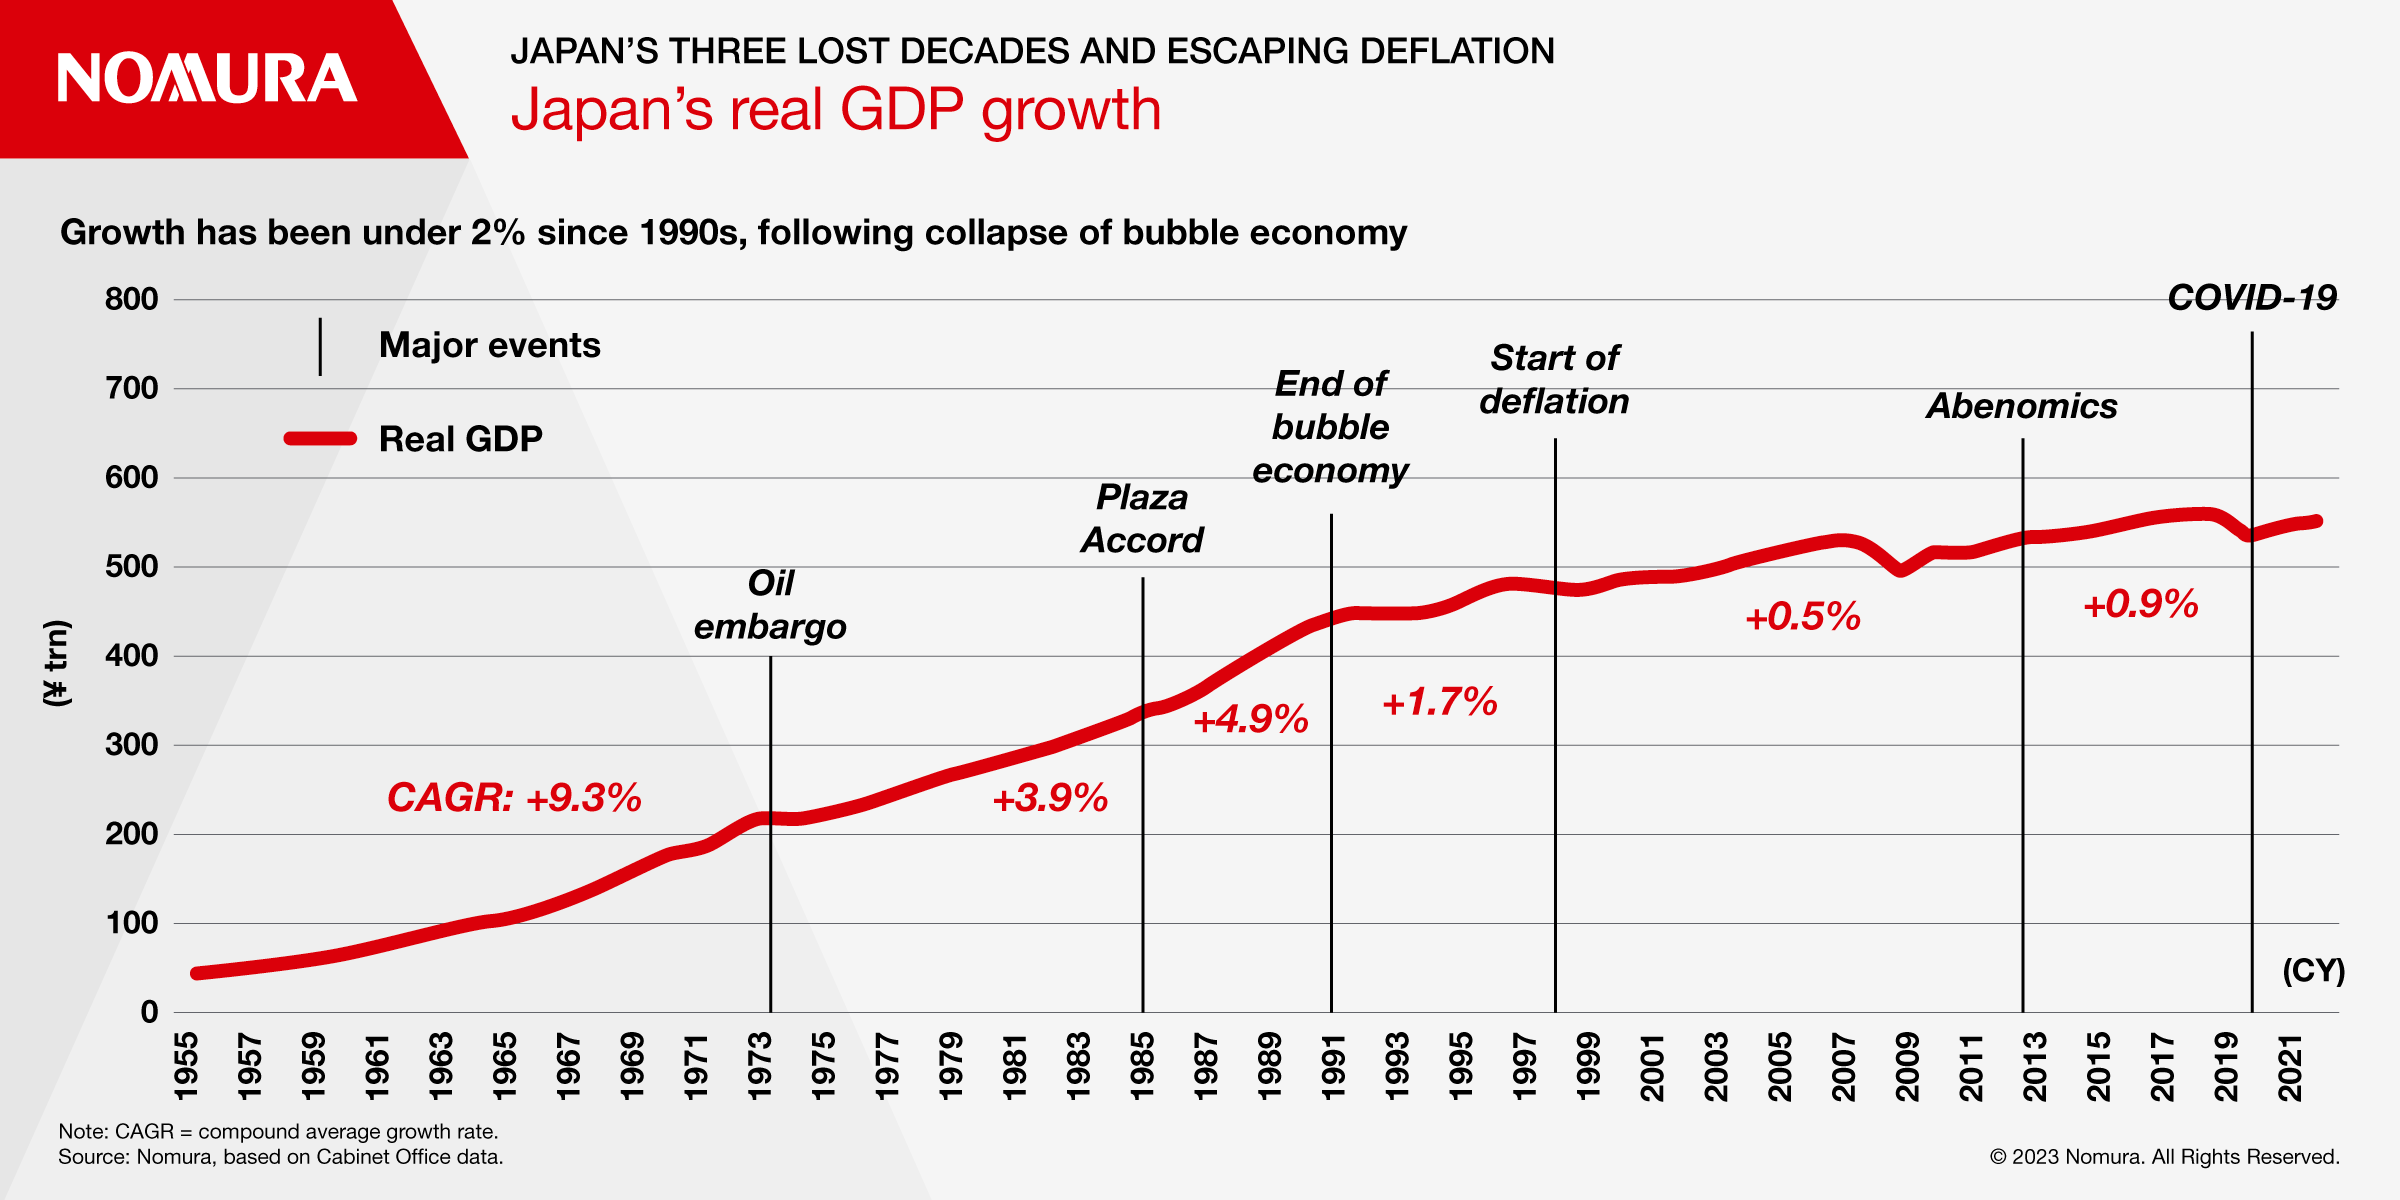
This graph clearly shows the "End of bubble economy" around 1991, followed by a dramatic drop in the real GDP growth rate. The high-growth era was definitively over.
Japan's deflation, problems in the financial system and ... (Figure 1 Rate of inflation in Japan)
This figure from the BIS paper you just read shows the CPI and GDP deflator from 1981-2003. You can visually confirm the disinflation of the early 90s and the crossover into negative territory (deflation) in the mid-to-late 90s.
This first phase, roughly 1990-1997, can be characterized as a post-bubble recession and disinflation, but the true deflationary era was yet to begin.
2. Phase 1: Debt-Deflation and Banking Crisis (Late 1990s)
By the mid-to-late 1990s, the economy had transitioned from disinflation to outright deflation. This period was defined by a vicious feedback loop first described by Irving Fisher during the Great Depression: the debt-deflation spiral.
The following video provides an excellent narrative of how this mechanism took hold in Japan and culminated in a full-blown banking crisis.
Video (7 minutes):
Watch this segment on the 1990s from the "Money & Macro" channel.
As you watch, focus on:
- How falling prices increased the real burden of the debts left over from the bubble era.
- How this led to reduced spending, which in turn pushed prices down further.
- The parallel feedback loop between the struggling economy and the banking sector, which was burdened by non-performing loans ("zombie loans").
- The culmination of these pressures in the 1997-1998 banking crisis.
This phase, from approximately 1998 to the early 2000s, marks the first and most dangerous stage of Japan's deflation. It was characterized by negative CPI, stagnant GDP, and a financial system on the brink of collapse.
3. Phase 2: The Expectations Trap and Early QE (The 2000s)
Even after the banking crisis was contained and the worst of the bubble-era debt was resolved, deflation persisted. The 2000s were characterized by a new, more insidious problem: an inflation expectations trap.
Essentially, after years of falling prices, firms and households began to expect prices to continue falling. This became a self-fulfilling prophecy.
Video (7 minutes):
The next segment from the same video explains this phenomenon and the Bank of Japan's initial, experimental policy responses.
Key points to note:
- The role of adaptive expectations: people formed their view of future inflation based on past inflation (which was negative).
- The Bank of Japan's response: cutting interest rates to zero (Zero Interest-Rate Policy, or ZIRP) and pioneering Quantitative Easing (QE).
- The brief escape from deflation around 2006-2007, which was quickly reversed by the 2008 Global Financial Crisis (GFC). The GFC hit Japan's export-dependent economy hard, plunging it back into a deep recession and deflation.
This phase, from the early 2000s to about 2012, was one of chronic, mild deflation and low growth, where conventional monetary policy was ineffective (a "liquidity trap") and unconventional policies were deployed with only modest success.
4. Phase 3: Abenomics and the Fight for 2% Inflation (The 2010s)
The persistent deflation and the shock of the GFC prompted a dramatic shift in policy with the election of Prime Minister Shinzo Abe in 2012. His "Abenomics" program was a radical, all-out assault on deflation.
Video (8 minutes):
This final segment details the "three arrows" of Abenomics and their impact on the Japanese economy.
Focus on the three arrows:
- Monetary Policy: A massive expansion of QE, negative interest rates, and an explicit 2% inflation target.
- Fiscal Policy: Increased government spending, but also controversial consumption tax hikes.
- Structural Reforms: Efforts to increase competition and labor force participation.
Let's look at the data to see the effect.
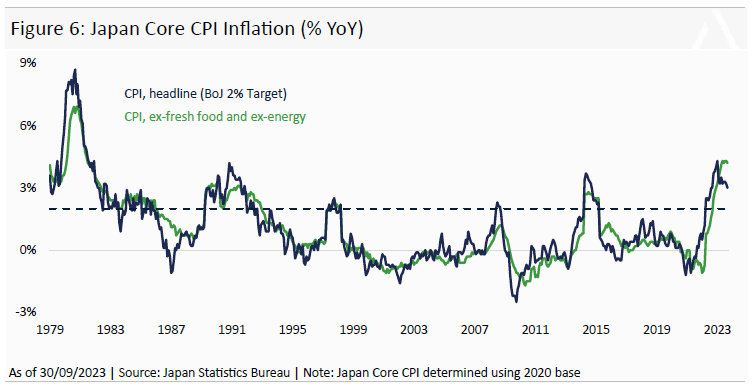
This graph clearly shows the impact of Abenomics. From 2013, inflation (the blue line) rises, finally breaking out of negative territory for a sustained period. However, it consistently falls short of the 2% target and dips back towards zero by the end of the decade.
This phase, from 2012 to around 2020, can be defined by the massive policy experiment of Abenomics. It succeeded in ending chronic deflation but failed to achieve its ultimate goal of generating stable 2% inflation.
5. Phase 4: The Pandemic and the Return of Inflation (2020-Present)
The most recent phase has been shaped by two global events: the COVID-19 pandemic and the subsequent global inflationary surge.
A recent speech by the Bank of Japan's Deputy Governor provides a perfect summary of this current situation.
Reading (2 minutes):
Please read the introduction from this 2024 speech.
This section notes that after the QQE/YCC policies of the 2010s failed to reach the 2% goal, the recent global inflation has pushed Japan's inflation rate to around 3%. The "big question" now is whether this marks a permanent, structural escape from the deflationary mindset.
The CPI graph we just looked at visually confirms this recent spike, showing both core and headline inflation finally rising well above the 2% target in 2022-2023.
Synthesis: Charting the Timeline
Let's consolidate our findings into a clear timeline of Japan's deflationary era.
| Phase | Period (Approx.) | Key Events & Characteristics | CPI Trend | Real GDP Growth Trend |
|---|---|---|---|---|
| 0 | 1990-1997 | Bubble Burst & Disinflation: Asset price collapse, start of the "Lost Decade." | Positive but falling (Disinflation) | Sharp slowdown, low positive growth |
| 1 | 1998-2002 | Debt-Deflation & Banking Crisis: Vicious cycle of debt and falling prices, 1997 Asian crisis, 1998 bank failures. | Negative (Deflation) | Stagnant, with recessions |
| 2 | 2003-2012 | Expectations Trap & GFC: ZIRP and early QE, persistent deflationary mindset, hit by 2008 GFC. | Mostly negative, mild deflation | Low positive growth, sharp GFC recession |
| 3 | 2012-2020 | Abenomics: Massive QE, 2% target. Deflation ends but target is missed. | Mostly positive but below 2% | Modest positive growth |
| 4 | 2020-Present | Pandemic & Global Inflation: COVID-19 shock, followed by a surge in inflation driven by global factors. | Surges above 2% target | Volatile, impacted by COVID |
Conclusion
In this lesson, we have charted the long, complex timeline of Japan's struggle with deflation. We moved from the initial asset price collapse of the early 1990s into distinct phases, each defined by different economic challenges and policy responses.
Key Takeaways:
- Japan's journey into deflation was not immediate; it began with a period of disinflation in the early 1990s before outright deflation took hold around 1998.
- The late 1990s were characterized by a dangerous debt-deflation spiral and a severe banking crisis.
- The 2000s saw the emergence of an inflation expectations trap, which was difficult to break even with ZIRP and early QE, and was exacerbated by the GFC.
- The Abenomics era (2010s) represented an all-out policy assault that succeeded in ending deflation but failed to create sustained 2% inflation.
- The most recent period has seen inflation return to Japan, but primarily due to global shocks, leaving the question of a permanent structural shift unanswered.
Next Lesson Preview:
Now that we have established the timeline of what happened, our next lesson will delve deeper into what was done about it. We will systematically map the major monetary and fiscal policy responses to the corresponding phases of this timeline, preparing us to evaluate their effectiveness in a later lesson.
Can't find a good explanation? Sign up and we'll make it for you
Sign up