
Welcome back. You have now completed Questions 1–44 of the challenge, including calculations, fractions, ratio, algebra, measurement, and geometry. The final six questions focus on statistics and mixed reasoning: reading information carefully, choosing the correct calculation, and showing enough working to earn method marks.
Data questions are rarely difficult because of one enormous calculation. They become difficult when the data is presented in a table, chart, or graph and you must decide what each number means before calculating. Today you will complete Questions 45–50.
A SATs routine for tables and charts
Before doing any calculation, pause and ask:
- What does the chart show? Read its title and both axis labels.
- What is being counted? People, points, days, temperatures, or something else?
- What exactly is the question asking for? A total, difference, mean, percentage, or change?
- What data do I actually need? Ignore information that is interesting but unnecessary.
- Does my answer make sense? For example, a mean should usually sit somewhere near the values in the data.
For a mean, which is another word for average, use:
The key difficulty with a frequency table is this: the denominator is the total frequency, not the number of rows in the table.
Math Antics - Mean, Median and Mode
Watch “Math Antics – Mean, Median and Mode” by mathantics for a clear visual explanation of why a mean represents an equal sharing of the total.
Watch finding the mean. Focus on the two steps: add all values to make one total, then divide by the number of data values. Notice that the mean does not have to be a number that appears in the data.
Question 45: Mean from a frequency table
The Age and Frequency image shows the ages of 15 children.
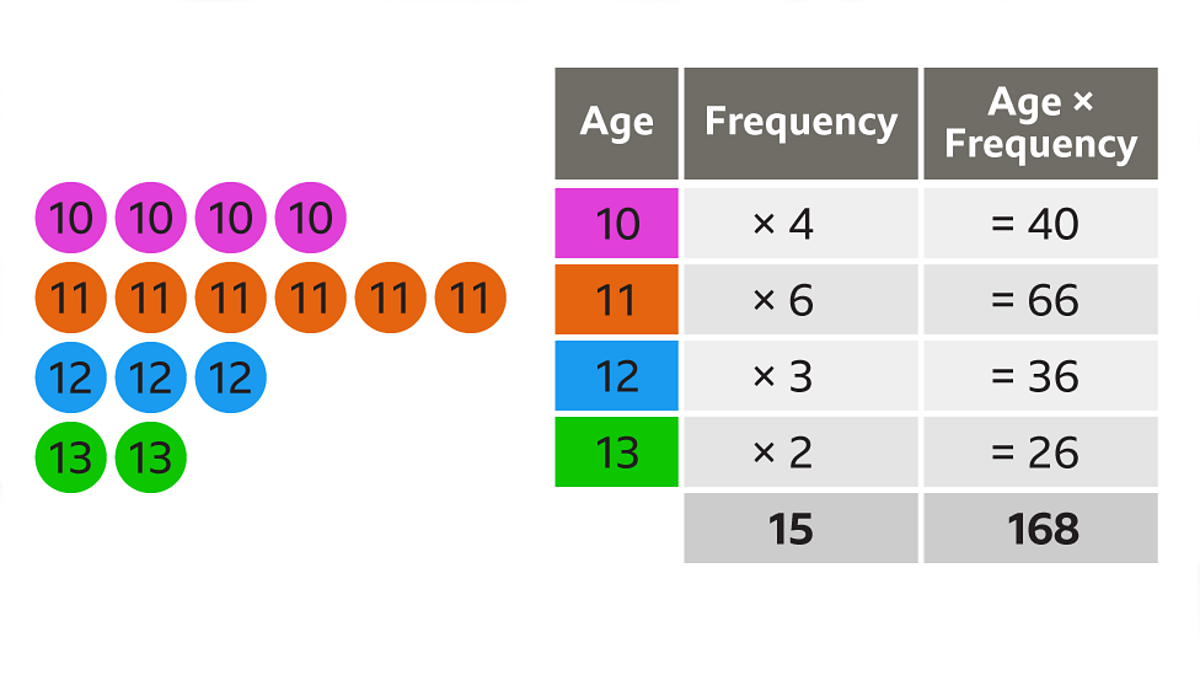
Find the mean age of the children.
The table already gives the two totals needed:
- total of all ages:
- number of children:
So:
The answer is not a whole number, and that is completely fine. It does not mean there is a child aged years. It means that if the total of 168 years were shared equally among all 15 children, each would have years.
A common error would be to add the four ages, , then divide by . That ignores the fact that some ages occur much more often than others.
Reading line graphs: values, changes, and range
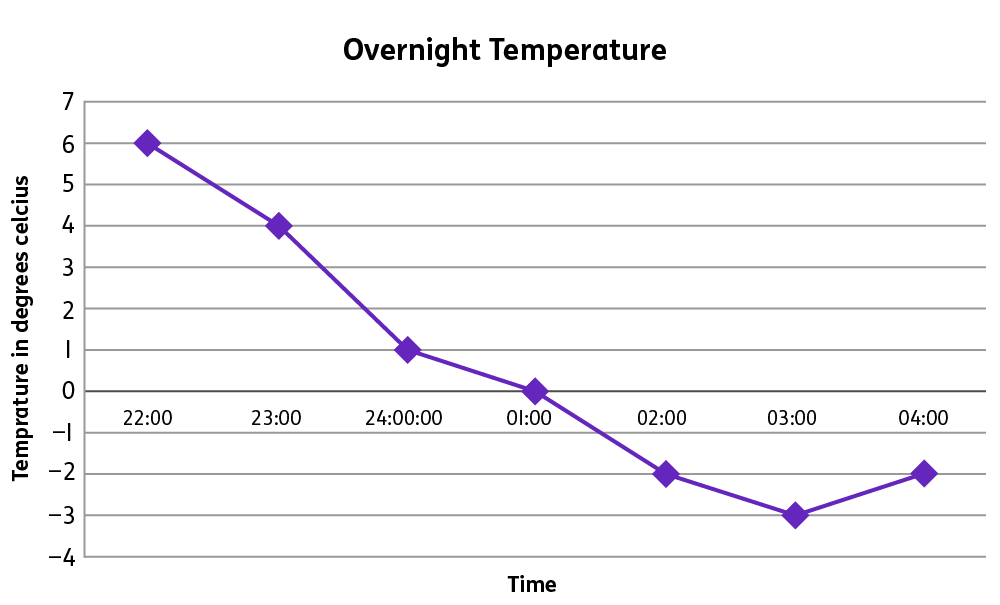
A line graph often shows a value changing over time. Read the point on the graph at each time; the line between points helps you see whether the value increased or decreased.
The range tells you how spread out the data is:
When negative numbers are involved, be especially careful. Subtracting a negative number increases the answer.
Question 46: Temperature changes over time
Use the Overnight Temperature graph.
- Between which two consecutive readings did the temperature fall by the greatest amount?
- How many degrees did the temperature fall altogether from 22:00 until 03:00?
- What happened to the temperature between 03:00 and 04:00?
First, list the temperatures shown:
| Time | Temperature |
|---|---|
| 22:00 | |
| 23:00 | |
| 00:00 | |
| 01:00 | |
| 02:00 | |
| 03:00 | |
| 04:00 |
For part 1, compare each fall. The largest is from to :
So the greatest fall was between 23:00 and 00:00.
For part 2, compare the starting temperature with the temperature at 03:00:
For part 3, the temperature changed from to . Since is greater than , the temperature rose by .
Question 47: Correcting an average
Eight test scores were entered into a spreadsheet:
The spreadsheet showed a mean score of . Later, the teacher noticed that the first score had been entered as , but it should have been .
What is the correct mean score?
You could add all eight new scores again, but a quicker SATs method is to notice the correction.
The score increased from to :
So the total score increases by .
The original total was:
The corrected total is:
Now divide by the same number of test scores, :
Only one score changed, so the number of scores did not change. It is still essential to divide by , not by or .
Percentages and pie charts
A pie chart represents one whole group:
Useful facts include:
For percentages of an amount, first find a useful fraction of the total. If the total is divisible by , finding is often the fastest start.
Question 48: Percentage data in two forms
A survey of pupils gave these results:
| Label | Percentage |
|---|---|
| A | |
| B | |
| C | |
| D | |
| E |
- What angle should label D have on a pie chart?
- How many pupils are in categories B and E altogether?
For part 1, label D is . Since of a full pie chart is :
For part 2, first combine the percentages:
Find of :
Then find and :
So:
[PDF] 2024 key stage 2 mathematics Paper 3: reasoning - GOV.UK
Read two official SATs-style data questions from the 2024 KS2 Mathematics Paper 3 on GOV.UK. They are useful because they require you to decide which information matters and then show a clear method.
On page 15, find Question 14, beginning the percentage table. Look at how each percentage must be represented as part of a complete pie chart. Then on page 16, read Question 15 from the pet dog question. Identify the two stages: find the number with pet dogs, then subtract the boys to find the girls.
Question 49: Total, mean, then a decision
The Red team earned house points over four days.
| Day | Points |
|---|---|
| Monday | 18 |
| Tuesday | 24 |
| Wednesday | 30 |
| Thursday | 12 |
On Friday, the Red team earned another points.
The team receives an award if its mean number of points per day is at least . Does the team receive the award?
Start with the four-day total:
Add Friday’s points:
There are now days of data, so calculate the mean:
The award requires a mean of at least . Since is greater than :
The phrase at least includes the target number itself and anything greater. A mean of exactly would also earn the award.
Question 50: Frequency, percentage, and mean
In a reading week, pupils recorded how many books they finished.
| Number of books finished | Frequency |
|---|---|
- What percentage of pupils finished at least books?
- What was the mean number of books finished?
- A teacher says, “On average, each pupil finished 2 books.” Is this exact?
Part 1: Percentage finishing at least two books
“At least ” means , , or books.
Find the total number of pupils:
So the fraction is:
Convert it to a percentage. Since , multiply the numerator by too:
Part 2: Mean number of books
Multiply each number of books by its frequency.
| Books | Frequency | Books frequency |
|---|---|---|
Find the total number of books:
There are pupils:
Part 3: Is the teacher exactly correct?
No. The exact mean is , not .
However, rounds to to the nearest whole number. So the teacher’s statement is reasonable only if it is rounded.
Key takeaways
You have completed all 50 questions in the Year 6 SATs Mathematics Challenge.
For data and mixed-reasoning questions, remember:
- A mean is the total divided by the number of values.
- In a frequency table, multiply each value by its frequency before adding.
- The total frequency tells you how many data values there are.
- On a line graph, check the scale and read the coordinates of the plotted points carefully.
- A pie chart represents a full , or .
- For multi-step questions, write one clear calculation for each stage.
- Words such as altogether, difference, at least, mean, and percentage tell you what mathematical action may be needed.
- Check that your final answer fits the situation and includes the correct unit.
You now have a full set of worked examples across the main Year 6 SATs mathematics topics. The next useful step is to attempt mixed questions without looking at worked solutions first, then use these methods to check where each answer came from.
Can't find a good explanation? Sign up and we'll make it for you
Sign up