
Hello and welcome back to your training!
In our last lesson, we focused on fingerprinting the web server and its underlying technologies with tools like Wappalyzer and Nikto. That process helps you find known vulnerabilities in common software. Today, we'll dive deeper into the application's unique structure.
This lesson addresses the learning outcome: Enumerate API endpoints by analyzing application traffic and client-side JavaScript files.
Modern web applications are often just a pretty face—a JavaScript-heavy frontend that communicates with a backend Application Programming Interface (API). Finding all the API endpoints, especially those that are hidden or undocumented, is a crucial step in discovering the application's true attack surface. This is where many high-impact bugs are found.
We'll cover two primary methods for this:
- Passive Enumeration: Analyzing the traffic the application generates during normal use.
- Active Enumeration: Sifting through the application's client-side code to find endpoints the user interface might not expose.

1. The Low-Hanging Fruit: API Documentation and Traffic Analysis
Before you start digging into code, the first step is always to look for a map. Many organizations provide API documentation to help developers integrate with their services. Finding this documentation can give you a complete list of intended endpoints, parameters, and request structures.
API testing | Web Security Academy
The Web Security Academy by PortSwigger offers an excellent introduction to API reconnaissance. This section explains what API endpoints are and the critical role documentation plays in discovering them.
Please read the introduction, the 'API documentation' section, and its subsection 'Discovering API documentation'. Focus on the common paths where documentation is often found (e.g., /api, /swagger/index.html).
Even without explicit documentation, you can learn a great deal simply by using the application with Burp Suite running. Every action you take—logging in, viewing a profile, adding an item to a cart—sends requests to the backend. These requests reveal the API endpoints responsible for that functionality.
Your workflow for traffic analysis:
- Configure your browser to proxy through Burp Suite.
- Navigate through the target application, exercising as much functionality as possible.
- In Burp Suite, go to the Proxy > HTTP history tab or the Target > Site map tab.
- Filter for requests that look like API calls. Common patterns include URLs containing
/api/,/v1/,/v2/, or ending in.json. - Send interesting requests to Burp Repeater (
Ctrl+R) to begin manually testing them.
The following video demonstrates this process and shows how to begin interacting with a discovered endpoint.
Finding and Exploiting an Unused API Endpoint
This video from Intigriti shows a bug bounty hunter identifying an API endpoint through normal application use and then manipulating it in Burp Repeater to find a vulnerability.
Watch from 00:19 to 02:29. Pay attention to how the hunter first identifies the /api/product/.../price endpoint by browsing the site and then uses Burp Repeater to change the HTTP method from GET to OPTIONS and PATCH to discover hidden functionality.
2. Hunting for Secrets: Finding Endpoints in JavaScript
Traffic analysis only shows you the endpoints the application intends for you to use. The real goldmine for a bug bounty hunter is often in the client-side JavaScript files, which can contain references to:
- Endpoints for features that are still in development.
- Administrative or internal-only endpoints.
- Deprecated but still active endpoints.
Given your background in Computer Science and comfort with reading JavaScript, this is an area where you can excel.
Manual Analysis: The Power of Ctrl+F
The simplest method is to manually review the JavaScript files loaded by the application.
- Open your browser's Developer Tools and go to the Network tab. Filter by "JS".
- Reload the page to see all the JavaScript files that are loaded.
- Open each file (especially large ones like
app.jsormain.js) in a new tab or in the Sources tab. - Use the find function (
Ctrl+F) to search for keywords that indicate an endpoint, such as:api//v1/,/v2/endpointpath:fetch(axios.https://orhttp://(to find absolute URLs)
This manual approach helps you understand the application's logic, but it can be time-consuming.
Automated Analysis: Tools of the Trade
To speed up the process, you can use command-line tools to automate the gathering and analysis of JavaScript files. This is a standard part of any professional's reconnaissance workflow.
Powerful $1000 Bug Bounty Guide: Discover Hidden Endpoints in JavaScript JS Files
This article from Hackersatty provides a fantastic, practical guide to JavaScript analysis for bug bounties. It covers both the 'why' and the 'how', including specific command-line tools and commands.
Read 'Step 1: How to Read and Download JavaScript Files', 'Step 2: Extract API Endpoints and Directories', and 'Step 3: Detect HTTP Methods'. Pay close attention to the tools mentioned (waybackurls, gau, subjs) and the grep commands provided. These are powerful one-liners you will use often.
As the article describes, a common workflow looks like this:
- Gather JS File URLs: Use a tool like
subjsorgauto collect all known JavaScript file URLs for a target domain.# Example using gau to get URLs from the Wayback Machine gau example.com | grep '\.js$' > js_files.txt - Download the Files: Use
wgetorcurlto download all the files from the list.# Download all files listed in js_files.txt wget -i js_files.txt - Search for Endpoints: Use
grepwith a regular expression to extract anything that looks like a path or endpoint from all the downloaded files.# A regex to find relative paths in quotes grep -Erho '(\"|'\''|`)(\/[^\"'\''`]+)(\"|'\''|`)' *.js | sort -u
More advanced tools like LinkFinder are specifically designed for this purpose, combining these steps into one.
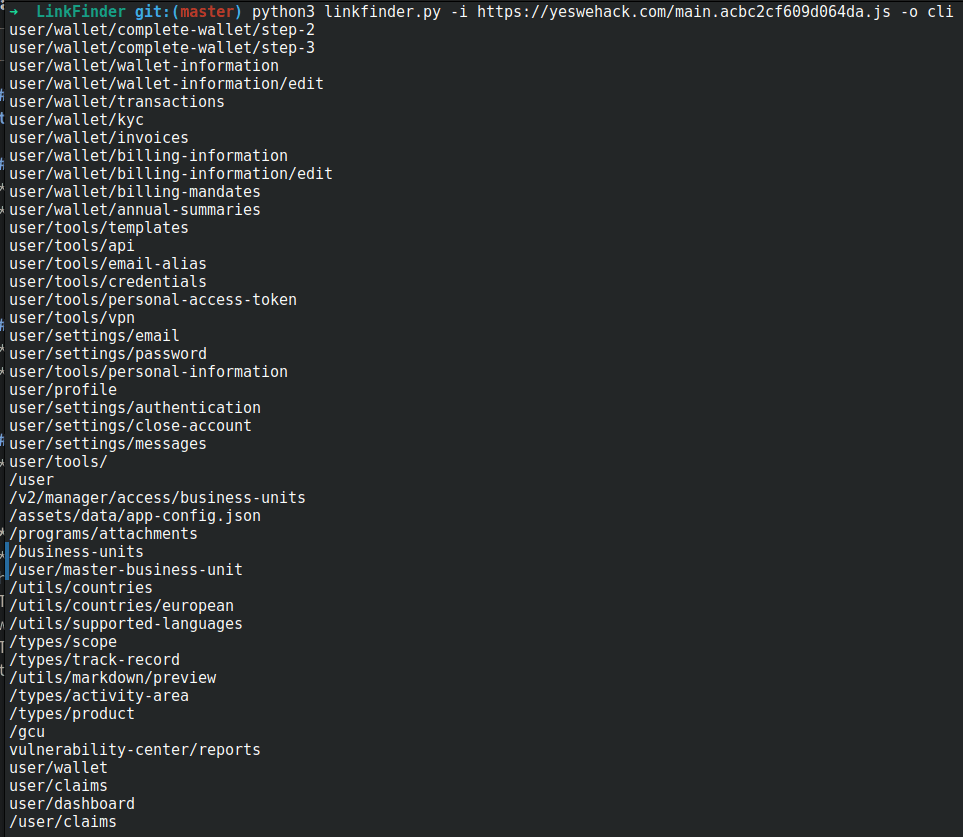
The following video showcases a modern, tool-assisted workflow for JavaScript reconnaissance.
JavaScript Recon Masterclass: Turn Bugs into Big Rewards
The Lostsec channel demonstrates a comprehensive workflow for JavaScript recon, combining manual inspection with powerful command-line tools.
Watch the entire video (around 8 minutes), but focus on these two parts: Manual/Browser-based (00:03 - 03:19): Observe the use of browser extensions like 'Endpointer' to automatically parse endpoints from the current page's JS files. This is a quick way to get started. Automated/CLI-based (03:19 - 07:51): This is the core of a professional workflow. Pay attention to how tools like Katana (to crawl for JS files), httpx (to validate URLs), and JSLeak (to find endpoints and secrets) are chained together.
Test your understanding!
While analyzing a JavaScript file for an e-commerce site, you discover the following code snippet:
function applyDiscount(code) {
  // TODO: move this logic server-side before launch
  if (code === "STAFF50") {
    fetch('/api/v1/cart/apply-coupon', {
      method: 'POST',
      body: JSON.stringify({ coupon: code, discount_percent: 50 })
    });
  } else {
    // Regular coupon logic...
  }
}

// Internal endpoint for price adjustments
// var internalApi = '/api/internal/set-product-price';
What are the two most interesting findings here, and what would be your immediate next steps for each?
Show answer
The two most interesting findings are:
-
Hardcoded "STAFF50" Coupon Logic: The frontend code contains logic for a 50% staff discount. Even if the UI doesn't allow you to enter this, the backend endpoint
/api/v1/cart/apply-couponmight still accept it.- Next Step: Go to Burp Repeater, craft a
POSTrequest to/api/v1/cart/apply-couponwith the JSON body{"coupon": "STAFF50", "discount_percent": 50}, and see if the server applies the discount to your cart. You might even try manipulating thediscount_percentvalue.
- Next Step: Go to Burp Repeater, craft a
-
Commented-Out Internal Endpoint: The line
var internalApi = '/api/internal/set-product-price';reveals a potentially powerful internal endpoint. It's commented out, so the UI doesn't use it, but the endpoint might still be active on the server.- Next Step: In Burp Repeater, start probing the
/api/internal/set-product-priceendpoint. Try different HTTP methods (GET,POST,PUT). Try to guess what parameters it might need, likeproduct_idandprice. Finding an unauthenticated price-setting endpoint would be a critical vulnerability.
- Next Step: In Burp Repeater, start probing the
Conclusion
You've now learned how to map out an application's API—the very foundation of its functionality and attack surface. By moving beyond what's visible in the user interface and digging into traffic and source code, you've taken a significant step toward thinking like a professional security researcher.
Key Takeaways:
- API Endpoint Enumeration is the process of identifying all possible API endpoints for a target application.
- Start by looking for API documentation and analyzing network traffic in Burp Suite as you browse the application.
- The most valuable findings often come from analyzing client-side JavaScript files for hidden, internal, or unlinked endpoints.
- You can perform JS analysis manually by searching for keywords or automatically by using a toolchain (
gau,grep, LinkFinder, etc.) to collect, download, and parse JS files. - Every discovered endpoint is a new potential entry point for bugs like IDOR, authorization bypasses, and injection attacks.
Next Lesson Preview:
Now that you know how to find API endpoints, the next logical question is: how are they protected? In our next lesson, we will explore how to differentiate between common API authentication patterns like API Keys, Bearer Tokens (JWT), and OAuth. This will equip you to start testing for the authentication flaws we will cover in Module 4.