
Hello! Welcome back to the course.
In our last lesson, we focused on understanding the "big picture" of a web application. You learned to manually trace user workflows and analyze business logic from a high-level, server-side perspective, primarily using Burp Suite.
Today, we're shifting our focus from the server to the client. Modern web applications execute a vast amount of code directly within your browser. Understanding this client-side code is not just optional; it's essential for discovering a whole class of vulnerabilities. This lesson will teach you how to use browser developer tools to inspect and analyze client-side code (HTML, CSS, and JavaScript). For a bug bounty hunter, mastering DevTools is as fundamental as mastering Burp Suite.
Given your background in Computer Science and your comfort with JavaScript, you are well-positioned to excel at this. We will move beyond just looking at code and focus on how to dynamically analyze and manipulate it to uncover security flaws.
1. Your In-Browser Hacking Lab: An Introduction to DevTools
Every modern browser comes equipped with a powerful suite of "Developer Tools." While designed for developers to build and debug applications, for a security professional, they are an indispensable toolkit for reverse-engineering and testing.
You can access these tools easily:
- Menu: In Chrome/Firefox, go to the main menu (the three dots/lines), select "More Tools" or a similar option, and then "Developer Tools."
- Right-Click: Right-click anywhere on a webpage and select "Inspect" or "Inspect Element."
- Keyboard Shortcut:
Ctrl+Shift+I(Windows/Linux) orCmd+Opt+I(Mac) is often the fastest way.
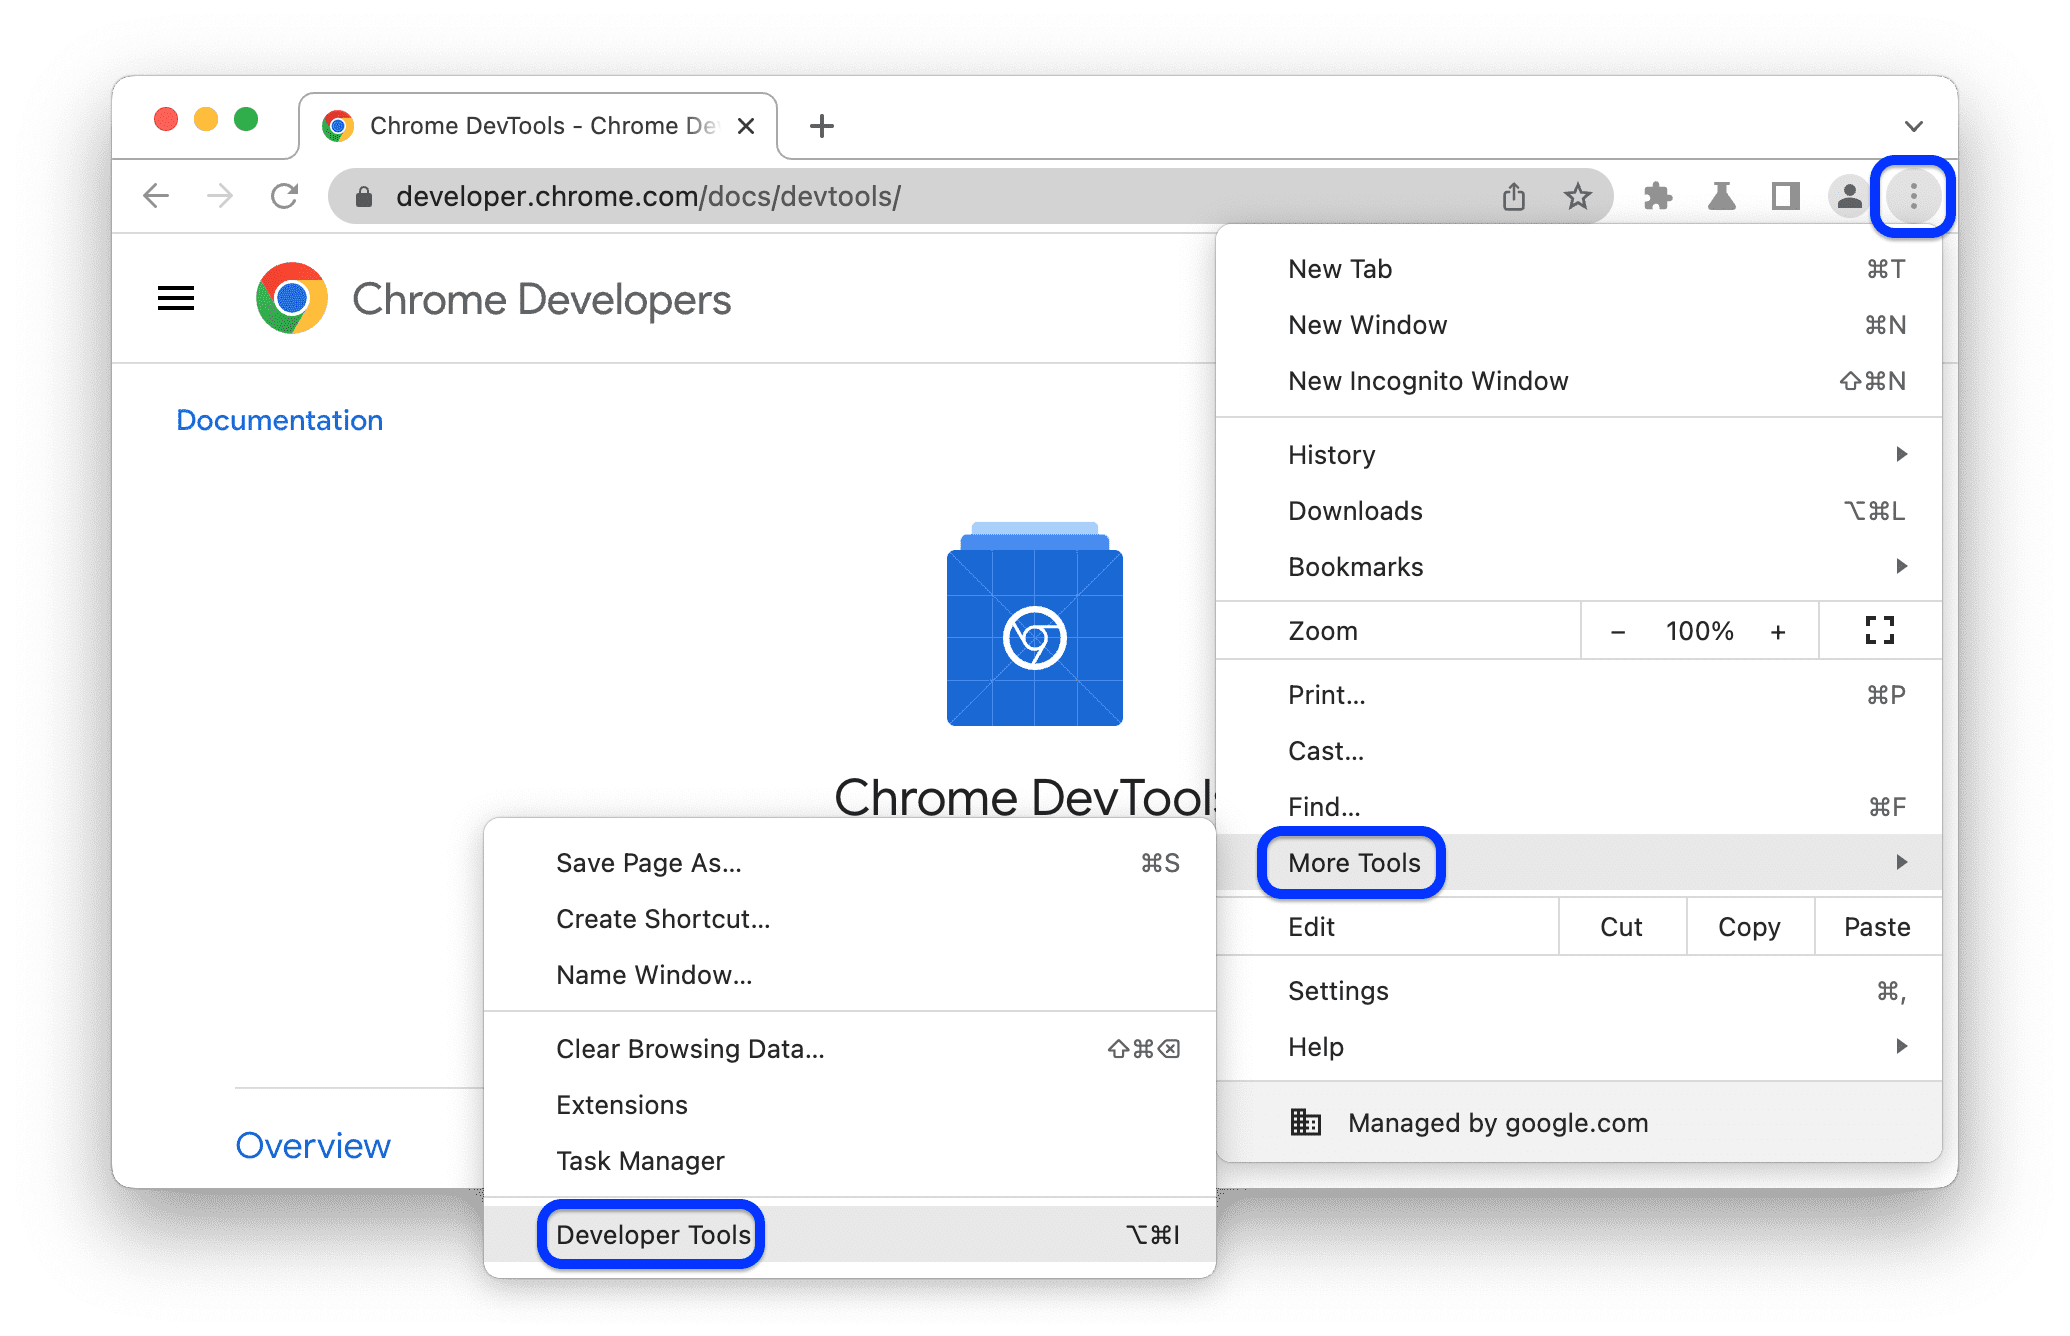
Once open, you'll see a panel with several tabs. We'll focus on the most important ones for security analysis: Elements, Console, Sources, and Network.

2. The Elements Tab: Deconstructing and Manipulating the UI
The Elements tab (called Inspector in Firefox) shows you the live Document Object Model (DOM) of the page. Think of the DOM as a tree data structure that represents the fully rendered page in your browser's memory. This is critically different from simply "viewing source," as the DOM includes all modifications made by JavaScript after the page initially loaded.
This tab allows you to find vulnerabilities that stem from excessive trust in client-side controls.
Security Testing With Web Developer Tools
To see this in action, please read the following article from DC864. It provides a great introduction to several DevTools tabs.
Read the section titled 'Inspector'. Focus on the example of bypassing a paywall. This demonstrates two key techniques you can use: Deleting DOM elements: Removing overlays that obscure content. Modifying CSS: Disabling styles that prevent actions like scrolling.
As you just read, you can directly edit the page. From a security perspective, look for opportunities to:
- Enable disabled buttons: A form button might be disabled with the
disabledattribute. Removing it might let you perform an action the developers assumed was inaccessible. - Reveal hidden fields: Input fields with
type="hidden"often contain important data like user IDs, item prices, or role identifiers. Making them visible (type="text") and modifying their values can lead to serious bugs. - Discover hidden functionality: Sections of the UI might be hidden using CSS (
display: noneorvisibility: hidden). Removing these styles can reveal admin panels or other sensitive features.
3. The Sources Tab: Reading and Debugging JavaScript
This is where your JavaScript skills become a superpower. The Sources tab (or Debugger in Firefox) lets you view every script loaded by the page and, more importantly, debug its execution.
Analyzing JavaScript is crucial for several reasons:
- Finding hidden API endpoints: JavaScript code contains the logic to call server-side APIs.
- Discovering information leaks: Developers sometimes accidentally leave API keys, secret tokens, or sensitive comments in the code.
- Identifying client-side vulnerabilities: Flaws like DOM-based XSS are found by analyzing how JavaScript handles user input.
This video from HackerOne provides an excellent, practical walkthrough of using DevTools for JavaScript analysis.
Hacker101 - JavaScript for Hackers (Created by @STOKfredrik)
Watch this video 'JavaScript for Hackers' to see a professional approach to analyzing client-side scripts.
Please watch from 03:21 to 12:38. This segment covers the essential workflow: Pretty Printing (03:21): How to make unreadable, minified JavaScript readable again. Static Analysis (04:21): Searching the code for keywords like 'API', 'secret', or endpoint paths. Dynamic Analysis (07:10): A deep dive into using breakpoints. Pay close attention to how the presenter pauses code execution to inspect the values of variables at runtime. This is the most powerful feature for understanding complex code and finding flaws like DOM XSS.
The key techniques to master here are:
- Static Analysis (Reading the code): Use the pretty-print feature (
{}) to format minified files. Then, use the global search (Ctrl+Shift+F) to look for interesting strings:api,secret,key,admin,dev,s3.amazonaws.com, etc. - Dynamic Analysis (Running the code): Set breakpoints on lines of interest. When the browser executes that line, it will pause, and you can inspect the "Scope" pane to see the values of all local and global variables. You can even modify them in the Console before resuming execution.
Test your understanding!
You are testing an e-commerce site. In the site's JavaScript, you find a function called applyCoupon(code). However, there is no visible coupon field on the checkout page.
Describe two different ways you could try to execute this function using only your browser's developer tools.
Show answer
-
Using the Console: The simplest way is to open the Console tab and directly call the function, guessing a potential coupon code. For example:
applyCoupon('SAVE20'). This works ifapplyCouponis a global function. -
Using the Debugger: A more robust method is to find another function that is called during the checkout process (e.g.,
updateTotal()). Set a breakpoint inside that function. When the code pauses, theapplyCouponfunction will likely be in scope. You can then call it from the Console tab while the application is paused, likeapplyCoupon('SAVE20'), and then resume execution to see if the discount was applied.
4. Advanced Techniques and Other Useful Tabs
While Elements and Sources are your primary tools, other tabs offer powerful capabilities.
The Network Tab
This tab logs all network requests made by the browser. It's similar to Burp Suite's Proxy history. Use it to:
- Filter for
Fetch/XHRrequests to isolate API calls. - Inspect headers and response bodies for leaked information.
- Right-click a request and "Copy as cURL" to easily replicate it in a terminal, or use "Edit and Resend" (in Firefox) to quickly tamper with it.
The Application Tab
This tab (called Storage in Firefox) shows you everything the website stores on your machine: cookies, localStorage, sessionStorage, etc. This is a goldmine for security testing. Look for:
- Session Tokens & JWTs: Can you decode them? Are they securely configured?
- User Information: Does the site store user roles, IDs, or preferences insecurely on the client-side?
- Feature Flags: Sometimes you can enable beta features by changing a value here (e.g., from
beta_user: falsetobeta_user: true).
Pro-Tips Video
This short video demonstrates several advanced but powerful techniques.
Improve Your Hacking Skills Using Devtools | Bug Bounty Tips
The video 'Improve Your Hacking Skills Using Devtools' by Reconless provides several quick but powerful tips.
Watch the sections on the 'Memory' tab (03:23 - 04:22) and the 'Lighthouse' tab (04:22 - 05:23). These cover two advanced use cases: Memory Snapshots: How to find sensitive strings (like API paths) in memory that might be constructed dynamically and thus invisible to static analysis in the Sources tab. Lighthouse Reports: How to quickly identify if the application is using outdated and vulnerable JavaScript libraries.
Conclusion
You now have a solid foundation for using browser developer tools as a core part of your security analysis workflow. While tools like Burp Suite are essential for manipulating server-side communication, DevTools give you unparalleled visibility and control over the client side. By combining both, you get a complete picture of the application's attack surface.
Key Takeaways:
- Elements Tab: Lets you inspect and modify the live DOM, which is useful for bypassing weak client-side controls like disabled buttons and hidden elements.
- Sources Tab: Your primary tool for JavaScript analysis. Use it to read code (static analysis) and debug it with breakpoints (dynamic analysis) to understand logic and find flaws.
- Network Tab: Provides a browser-native way to monitor all HTTP/S traffic, filter for API calls, and inspect requests/responses.
- Application Tab: Allows you to inspect and manipulate data stored on the client, such as cookies and local storage, which may contain sensitive information or control application state.
Next Lesson Preview:
Now that you can analyze an application's client-side code and server-side workflows, the next step is to fingerprint the underlying technology. In the next lesson, we will cover how to identify web server technologies, frameworks, and potential misconfigurations using tools like Nikto and Wappalyzer. This helps you quickly learn what you're up against and search for known public vulnerabilities.