
Good to see you again. Last lesson focused on how a study is designed: whether researchers impose a treatment (an experiment) or simply observe, and—if observational—whether data are cross-sectional, retrospective, or prospective.
This lesson asks a different question:
How did the researchers choose the people or items they studied?
That matters because a study can be observational or experimental and still use a poor sample. A sample that systematically leaves out, overincludes, or distorts certain groups can give a misleading picture of the population.
By the end of this lesson, you should be able to name the sampling method and explain one realistic way the results could be biased.
The basic goal: a sample that can speak for the population
Recall the terms from the first lesson:
- Population: the entire group we want to understand.
- Sample: the smaller group from which data are actually collected.
For example, if a college wants to estimate average weekly study time among all 12,000 students, the population is all 12,000 students. If it surveys 200 of them, those 200 students are the sample.
A sample does not need to match the population perfectly. Random chance means one random sample of 200 students may include slightly more first-year students than another. That ordinary, chance-based difference is called sampling variability.
Bias is more serious. Bias is a systematic problem: the method consistently favors some kinds of outcomes or people over others. A larger biased sample does not fix the problem. Surveying 10,000 people who volunteered because they have unusually strong opinions can still give a misleading result.
It helps to keep this distinction in mind:
| Idea | Meaning |
|---|---|
| Sampling variability | Random samples naturally differ by chance. |
| Bias | The selection or response process systematically pushes results away from the population truth. |
Also, do not confuse two kinds of “random” from the previous lesson:
- Random selection chooses people for the sample. It helps the sample represent the population.
- Random assignment places already-selected participants into treatments. It helps experiments compare treatments fairly.
Today is about random selection.
Five sampling methods to recognize
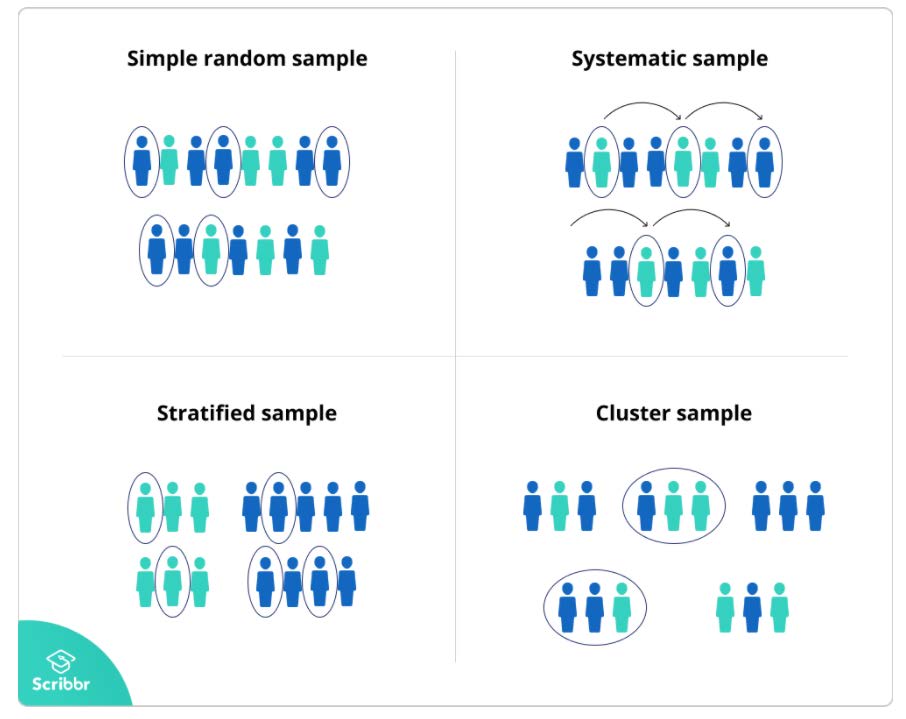
The fastest way to identify a sampling method is to look at the exact action used to choose participants. The “Sampling methods chart” below gives the central visual distinction among four probability-based methods.
Sampling Simple Random, Convenience, systematic, cluster, stratified - Statistics Help
Watch “Sampling Simple Random, Convenience, systematic, cluster, stratified - Statistics Help” from Dr Nic's Maths and Stats for a quick visual walk-through of the five main sampling methods. Focus especially on what is sampled: individual people, every group, or whole groups.
Watch from simple random sampling through systematic sampling. Then watch cluster sampling and stratified sampling. Notice the contrast between selecting some people from each group and selecting entire groups.
1. Simple random sample
A simple random sample (SRS) is selected so every individual in the population has an equal chance to be chosen. In the strictest definition, every possible sample of the chosen size is equally likely.
Typical clues:
- “Use a random-number generator to select 100 student ID numbers.”
- “Put every name in a hat and draw 25 names.”
- “Select 50 employee files at random from the complete employee list.”
The essential feature is that researchers start with a list of the whole population, often called a sampling frame, and use a genuine random process.
Example: A university numbers all 8,000 undergraduate students and uses software to choose 150 IDs. This is a simple random sample.
An SRS reduces selection bias, but it cannot guarantee perfect representation. By chance, a sample might contain a somewhat unusual mix of students. More importantly, it can still have nonresponse bias if many selected students do not answer.
2. Systematic sample
A systematic sample selects people at a fixed interval after a random starting point.
For example, a researcher has a list of 2,000 customers and needs 100 names. They randomly choose a starting position, then select every twentieth customer on the list.
Typical clues:
- “Every 10th name”
- “Every 50th item”
- “Every third patient on a list”
- “A random starting point, then every individual”
Systematic sampling is often easier than generating many separate random numbers. But it has a special possible weakness: periodicity. If the ordering of the list has a repeating pattern that lines up with the interval, the sample can be distorted.
Example: Suppose a factory’s production line alternates between two machines, and one machine tends to make slightly heavier products. Sampling every second product could accidentally select products from only one machine. The systematic method would then overrepresent that machine’s output.
A systematic sample is not automatically biased. The concern arises when the order of the population contains a relevant pattern.
3. Stratified sample
A stratified sample divides the population into meaningful subgroups, called strata, and randomly samples individuals from every stratum.
Typical clues:
- “Divide students by year level, then randomly select students from each year.”
- “Take a random sample from every department.”
- “Sample employees separately by job category.”
Example: A college has 40% first-year students, 30% second-year students, 20% third-year students, and 10% fourth-year students. To survey 200 students, it might randomly choose 80, 60, 40, and 20 students from those year levels. This is a proportionate stratified sample.
The purpose is to ensure that important groups are included. In an SRS, a small subgroup could be selected only a few times by chance. Stratification protects against that.
The key phrase is:
Some people are selected from every group.
4. Cluster sample
A cluster sample divides the population into natural groups, called clusters, randomly chooses some clusters, and includes all individuals within the selected clusters.
Typical clusters include:
- classrooms,
- city blocks,
- residence halls,
- schools,
- hospital wards,
- neighbourhoods.
Example: To study students’ commuting time, a university randomly selects four tutorial sections and surveys every student in those sections. The tutorial sections are clusters.
The key phrase is:
Entire groups are selected.
This is the sampling method most often confused with stratified sampling. Use this comparison:
| If the researcher… | Method |
|---|---|
| Selects people from each subgroup | Stratified |
| Selects some whole subgroups, then includes everyone in them | Cluster |
Clusters are usually chosen because they make data collection cheaper or easier. But if a few chosen clusters differ a lot from the rest of the population, results may not represent everyone well. For example, choosing only a few residence halls might miss commuter students entirely if the intended population is all university students.
5. Convenience sample
A convenience sample includes people because they are easy to reach rather than because they were randomly selected.
Typical clues:
- “Ask the first 100 people entering the library.”
- “Survey students in the researcher’s own class.”
- “Stand in a mall and ask passersby.”
- “Use whoever is available.”
Example: A student wants to estimate average sleep among all college students, so they ask 30 friends in their residence hall. This is a convenience sample.
Convenience samples are fast and inexpensive, but they often have sampling bias because accessible people may differ from the wider population. Residence-hall students may have different schedules, living conditions, or ages than commuter students.
A closely related case is a voluntary-response sample: people choose for themselves whether to respond.
Examples include:
- an online poll with a public link;
- a radio station asking listeners to call in;
- a social-media post asking, “Tell us what you think!”
Voluntary-response samples are especially vulnerable to self-selection bias. People with strong opinions, extra time, or a personal interest in the issue may be more likely to participate.
From “method” to “likely bias”
Identifying the method is only half the task. You also need to look for a mechanism that could make the sample or answers unrepresentative.
This reading from Penn State’s STAT 200 explains the main vocabulary and gives useful examples. Do not try to memorize every example; focus on the question, “Who is missing, more likely to respond, or less likely to answer honestly?”
Read “Collecting Data” from Penn State STAT 200 to connect sampling methods to the different ways bias enters a real study.
In Section 1.2.1, read the sampling-bias discussion, including both examples. Then, in Section 1.2.2, read simple random and convenience sampling. Finally, read Section 1.3, beginning with the two response-related biases. For each example, identify whether the problem occurs during selection, because people do not respond, or because responses may be untruthful.
Sampling bias or undercoverage
Sampling bias occurs when the way the sample is obtained makes some members of the population less likely to be selected than others.
A common form is undercoverage: part of the intended population is missing from the sampling frame or selection process.
Example:
A college surveys “all students” by emailing only students who are currently registered for in-person classes.
- Method: likely a convenience or flawed list-based sample, depending on how recipients were chosen.
- Likely bias: online-only students are excluded, so the results may not represent all students.
The important explanation is not merely “it is biased.” State why: a group in the target population had no chance, or a smaller chance, to be selected.
Nonresponse bias
Nonresponse bias occurs when selected people do not participate and the people who answer differ systematically from those who do not.
Example:
A researcher randomly selects 500 students and emails them a survey about campus parking. Only 80 respond.
The initial selection may be a simple random sample, but the completed responses can still suffer from nonresponse bias. Students who are frustrated with parking, or who drive to campus frequently, may be more motivated to reply than students who do not drive.
This is a major test-taking point:
A random sample can still produce biased final results if many selected people fail to respond.
Response bias
Response bias occurs when people participate but give inaccurate answers. They may want to seem socially acceptable, avoid embarrassment, please the researcher, or respond to a leading question.
Example:
A professor asks students in person, “You agree that this course has been taught very effectively, correct?”
Even if the students were randomly selected, the wording pressures them toward agreement. That is response bias caused by a leading question.
Another example:
A survey asks students whether they have cheated on an exam, but requires them to enter their name.
Students may answer “no” even if the true answer is “yes.” The likely problem is response bias because truthful answers may feel risky.
A reliable routine for test questions
When you see a sampling description, do not jump straight to “biased” or “random.” Use this routine.
Step 1: Identify exactly what was selected
Was it:
- individual people from a complete list?
- every person?
- people from every subgroup?
- whole groups?
- whoever was easiest to contact?
- people who chose to answer?
That identifies the likely method.
Step 2: State the method precisely
Use the course vocabulary:
- simple random
- systematic
- stratified
- cluster
- convenience
- voluntary response, when participation is self-selected
Step 3: Ask who may be missing or overrepresented
Look for details such as:
- one location only;
- one time of day;
- only social-media users;
- only people with internet access;
- only people who make a purchase;
- people who choose to answer;
- a list that leaves out part of the population.
Step 4: Name the most relevant bias
| Clue in the description | Likely concern |
|---|---|
| Easy-to-reach people are surveyed | Convenience sampling bias |
| People opt in or call in | Voluntary-response / self-selection bias |
| Selected people fail to answer | Nonresponse bias |
| A group cannot be selected at all | Undercoverage / sampling bias |
| A sensitive or leading question is used | Response bias |
| Every unit is selected from a patterned list | Periodicity in systematic sampling |
Step 5: Explain the mechanism in one sentence
A strong answer has this form:
This is a [method] sample. A likely source of [bias] is that [specific group or response pattern] may be overrepresented, underrepresented, or inaccurately measured.
For example:
This is a convenience sample because the researcher surveys students in the library. It may have sampling bias because students who study at the library could have different study habits from students who rarely use it.
Notice that you do not need to claim a precise direction unless the description supports one. It is safer to say “may not represent the population” than to guess that a result must be too high or too low.
Worked evaluations
Case 1: Every tenth customer
A grocery store manager wants to know whether all customers like a new store layout. From 1:00 p.m. to 3:00 p.m. on a Tuesday, an employee surveys every tenth customer entering the store.
Method: Systematic sampling, because every tenth customer is chosen.
Likely bias: The two-hour Tuesday-afternoon window may underrepresent customers who shop evenings, weekends, or other days. This is sampling bias caused by limited coverage in time.
The method’s interval is systematic, but the time and place restriction creates the concern.
Case 2: Samples from each year level
A university divides all undergraduates into first-, second-, third-, and fourth-year students. It randomly selects 50 students from each year level.
Method: Stratified sampling, because students are selected from every year-level stratum.
Likely bias: No obvious selection bias is stated if the lists are complete and students are randomly chosen within each group. However, if many selected students do not respond, nonresponse bias could occur.
This is an important kind of answer: not every probability-based sampling procedure has an obvious built-in bias.
Case 3: Chosen residence halls
A researcher randomly selects three residence halls and surveys every student living in those halls about sleep habits.
Method: Cluster sampling, because entire residence halls are randomly selected and all students in them are surveyed.
Likely bias: If the intended population is all university students, commuter students and students living off campus are excluded. That is undercoverage.
If the intended population were only students living in residence halls, the selection method itself would be more defensible—though three halls might still give a less stable picture if halls differ greatly.
Case 4: An open survey link
A student newspaper posts a link asking, “Should tuition be increased?” Anyone who sees the post can complete the poll.
Method: Voluntary-response sample.
Likely bias: Self-selection bias. Students with strong opinions about tuition are more likely to respond than students with neutral opinions or little time.
Case 5: A random sample with a sensitive question
A health researcher uses a random-number generator to select 300 students from the university roster. The survey asks respondents to report illegal drug use, using their university email accounts.
Method: Simple random sampling.
Likely bias: Response bias is likely because respondents may fear their answers could be identified and may underreport illegal behaviour. Nonresponse bias may also be possible if some selected students decline to participate.
The random selection was sound, but the measurement situation can still damage the data.
Key takeaways
To evaluate sampling, separate the two tasks:
-
Identify the method
- Random individuals from a full list: simple random
- Random start, then every : systematic
- Random people from every subgroup: stratified
- Randomly selected whole groups: cluster
- Easy-to-reach people: convenience
- People choose whether to participate: voluntary response
-
Identify a plausible bias mechanism
- Some groups are excluded: undercoverage / sampling bias
- Selected people do not answer: nonresponse bias
- Participants may not answer truthfully: response bias
- Strongly motivated people opt in: self-selection bias
- A regular pattern interacts with a systematic interval: periodicity
The central habit is to ask: Who had little or no chance to be selected, who may refuse, and who may not answer honestly?
Next, you will begin organizing collected numerical data by constructing a grouped frequency distribution with sensible class limits and class width.
Can't find a good explanation? Sign up and we'll make it for you
Sign up