
Hello. In the previous lesson, you used compiler diagnostics and sanitizers to identify a heap use-after-free. Sanitizers explain an error after an invalid operation is executed; GDB serves a complementary role. It lets you pause before or during a suspicious operation, inspect the currently active calls and variables, and follow execution one source-level statement at a time.
This lesson develops a compact, reusable GDB workflow in WSL. You will compile a small C++ program for debugging, stop inside a nested function call, inspect the stack frames and variables in both the current function and its callers, then control execution with stepping commands.
A debugger’s snapshot of a running program
A debugger runs your program under supervision. At a breakpoint, GDB pauses the process and gives you a prompt. The program’s state is preserved at that instant: the active function, the calls that led there, parameters, local variables, and the next source location to execute.
For C++ debugging, first build with debug information:
g++ -std=c++20 -Wall -Wextra -Wpedantic -g -O0 inspect.cpp -o inspect
Two flags matter especially here:
-gembeds debugging information. It lets GDB associate executable code with source files, function names, line numbers, and variables.-O0disables compiler optimization. This makes the relation between your source and the executed program much easier to inspect while learning.
Optimization does not make code “less correct,” but it can make debugging less literal. An optimizing compiler may inline a function, reuse a variable’s storage, eliminate a value, or rearrange operations while preserving observable program behavior. In GDB, this can produce messages such as optimized out or make stepping appear to skip around. For an initial investigation, use -g -O0.
If GDB is not installed in your WSL distribution, install it once:
sudo apt update
sudo apt install gdb
GDB’s fundamental cycle is:
- Set a breakpoint where useful state will exist.
- Run until execution stops.
- Inspect the current source location, variables, and call stack.
- Step, resume, or move out of a function based on what you need to learn.
Stack frames: why the call stack answers “how did we get here?”
Each active function call has a stack frame (also called an activation record). Conceptually, it preserves enough execution state for that invocation to run and later return to its caller. That state normally includes a way to return to the caller and may include parameters, local variables, saved registers, and temporary bookkeeping.
Suppose main calls summarize, which calls adjust. While adjust is running, all three calls are active. Their frames form the call stack:
| GDB frame number | Active function | Why it remains active |
|---|---|---|
#0 | adjust | It is the currently executing function |
#1 | summarize | It called adjust and awaits its result |
#2 | main | It called summarize and awaits its result |
GDB labels the innermost, currently executing frame as frame #0. Higher numbers are its callers. When adjust returns, its frame ceases to be active; summarize becomes the current frame and is relabeled #0.
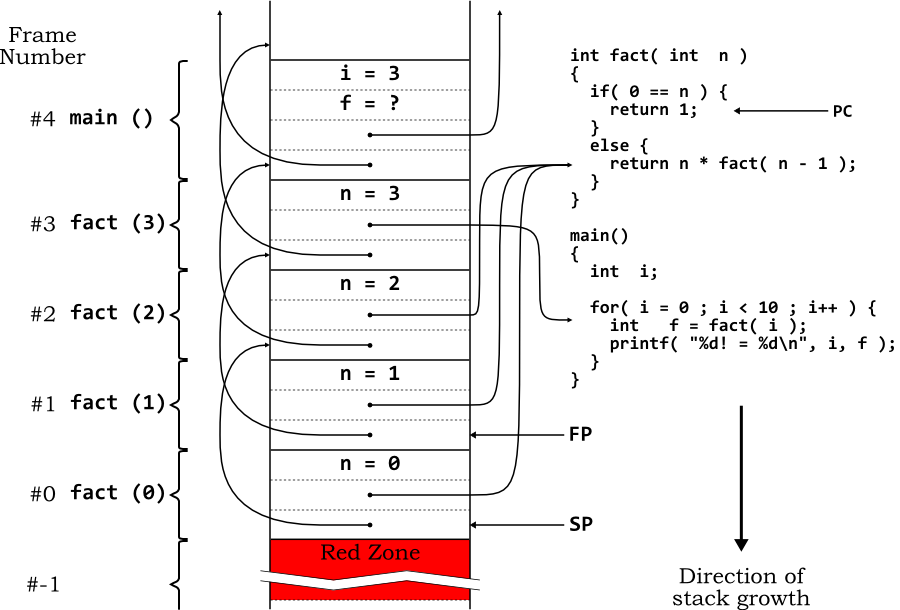
The image uses recursion, so several invocations of the same function are active simultaneously. GDB distinguishes them by frame number. This is why a backtrace is invaluable for recursive code, unexpected callback chains, and crashes deep in helper functions.
A useful caveat: “stack frame” is the debugging model you should use first. On a particular architecture and compiler configuration, some values may instead live in CPU registers, and optimized code can alter the physical layout substantially. GDB’s frame view remains useful because it reconstructs the source-level call context from debug information.
Watch “C/C++ Stack Frames and gdb” by John’s Basement for a visual model of calls creating frames, returning to callers, and reusing stack space.
Watch the call stack model. Focus on the distinction between a function definition and one particular active invocation of that function, and on why an unfinished caller’s frame remains available while a callee executes.
The small command set you need first
GDB has many commands, but a small group handles most early C++ investigations.
Read Stanford CS111’s compact command reference to consolidate the commands used in this lesson and see their standard abbreviations.
In the “Common Commands” section, read the command reference from the opening launch instruction through breakpoint deletion. Focus on break, run, backtrace, print, next, and step; treat the abbreviations as convenient, not mandatory.
Here is the practical command map:
| Goal | Command | Short form | Important meaning |
|---|---|---|---|
| Launch GDB with an executable | gdb ./inspect | — | Starts GDB; does not run the program yet |
| Set a function breakpoint | break adjust | b adjust | Pause when execution reaches adjust |
| Run the program | run | r | Start or restart the program |
| Show nearby source | list | l | Displays source around the selected location |
| Show current position | frame | f | Reports the selected stack frame and source line |
| Show all active calls | backtrace | bt | Lists frames from current function through callers |
| Select a caller frame | frame 1 | f 1 | Changes inspection context, not execution |
| Inspect arguments | info args | — | Shows parameters of the selected frame |
| Inspect locals | info locals | — | Shows local variables in the selected frame |
| Evaluate a C++ expression | print expr | p expr | Evaluates in the selected frame’s context |
| Step over a call | next | n | Executes the current source statement without entering called functions |
| Step into a call | step | s | Enters a called function when source is available |
| Finish current function | finish | — | Runs until the current function returns |
| Resume freely | continue | c | Runs to the next breakpoint, signal, or program end |
| List breakpoints | info breakpoints | i b | Shows number, location, and hit count |
| Remove breakpoint 1 | delete 1 | d 1 | Deletes a breakpoint by number |
For ordinary variable inspection, print is usually safe. Be cautious with expressions that call functions: calling a nontrivial function from a debugger can allocate memory, mutate state, acquire locks, or otherwise change the very behavior you are trying to understand.
Lab: inspect frames, variables, and control flow
Create inspect.cpp:
#include <iostream>

int adjust(int value) {
    const int doubled = value * 2;
    const int result = doubled + 3;
    return result;
}

int summarize(int start) {
    const int offset = 1;
    const int adjusted = adjust(start);
    return adjusted - offset;
}

int main() {
    const int input = 7;
    const int answer = summarize(input);

    std::cout << answer << '\n';
}
Before debugging, reason about the intended result:
mainpasses7tosummarize.summarizepasses7toadjust.adjustcomputes , which is17.summarizesubtracts1, leaving16.
Build and launch the debugger:
g++ -std=c++20 -Wall -Wextra -Wpedantic -g -O0 inspect.cpp -o inspect
gdb ./inspect
At the (gdb) prompt, set a breakpoint at the entry to adjust, then run:
break adjust
run
GDB should report that it stopped in adjust, with value=7. The highlighted line is generally the next source statement GDB associates with the current instruction location.
Start by viewing the local source context:
list
Then execute the two initialization statements one at a time:
next
next
You should now be stopped at or near:
return result;
At this point, both local values have been assigned. Inspect the current frame:
info args
info locals
print value
print doubled + result
The important observations are:
value = 7
doubled = 14
result = 17
and the expression doubled + result evaluates to 31. GDB evaluates names relative to the currently selected frame, which is currently adjust.
Now ask the central control-flow question: which calls led to this point?
backtrace
Your addresses and exact formatting will differ, but the logical structure should resemble:
#0  adjust (value=7) at inspect.cpp:...
#1  summarize (start=7) at inspect.cpp:...
#2  main () at inspect.cpp:...
Read this from top to bottom:
- Frame
#0: execution is currently paused insideadjust. - Frame
#1:summarizecalledadjustand has not received its result yet. - Frame
#2:maincalledsummarizeand has not received its result yet.
This is a dynamic execution history, not merely a list of functions that happen to exist in the source file.
Inspecting a caller without rewinding time
While stopped in adjust, select summarize’s frame:
frame 1
frame
info args
info locals
print start
print offset
The first frame command changes GDB’s inspection context. It does not make summarize execute again and does not move program control backward. It simply lets you inspect the caller’s currently suspended state.
You should find:
start = 7
offset = 1
Notice the subtle status of adjusted. The caller is paused in the middle of this initialization:
const int adjusted = adjust(start);
Since adjust has not returned yet, adjusted does not yet hold its final meaningful value. In a less controlled program, inspecting a variable before initialization is a common source of misleading debugger output. A debugger can show raw program state; it cannot turn an uninitialized value into valid information.
Return to the active frame before resuming execution:
frame 0
Now use finish:
finish
finish runs the remainder of the current function, adjust, and stops after control has returned to its caller. GDB now considers summarize the active frame, so it becomes frame #0.
Inspect its completed local state:
info locals
print adjusted
Now adjusted should be 17. Step once:
next
This executes the return expression in summarize, returning 16 to main. You should now be at or near the output statement in main.
At this point, inspect main:
info locals
print answer
The answer should be 16.
Checkpoint: before leaving this lab, your GDB session should have demonstrated all of the following:
backtraceshowedadjust,summarize, andmain.- Frame
#0was the active function at the instant of the breakpoint. frame 1let you inspectsummarize’s parameter and initialized local variable.finishreturned fromadjustwithout manually stepping through every remaining statement.- The final computed value was
16.
End the run cleanly:
continue
quit
Choosing next, step, finish, and continue
A debugger becomes efficient when your command matches your question.
| If you want to… | Prefer | Why |
|---|---|---|
| Verify how a local value changes across nearby statements | next | Moves through your current function predictably |
| Understand what a helper function does internally | step | Enters the called function |
| Escape a helper or library call you entered | finish | Completes the active function and returns to its caller |
| Reach a later breakpoint without watching intervening code | continue | Runs normally until GDB has another reason to stop |
Use next as the default when debugging your own high-level logic. A statement such as:
std::cout << answer << '\n';
can involve many standard-library function calls. step may take you deep into implementation details that are irrelevant to the suspected defect. Use next to execute that statement as one source-level unit.
Use step deliberately when a function’s internal behavior is exactly what you need to inspect.
Continue with John’s Basement’s “C/C++ Stack Frames and gdb” for a concise demonstration of setting up a debugging session, entering a function, and interpreting the resulting call stack.
Watch breakpoints and stepping to see start, list, and step used at source level. Then watch the frame view for the relationship between the active frame and its caller in a where/backtrace display.
Breakpoints as diagnostic hypotheses
A breakpoint should be placed where it can test an idea about the program.
For example:
break adjust
tests the hypothesis, “Does adjust receive the value I expect?”
A source-location breakpoint can be more precise:
break inspect.cpp:5
This says, “Pause when execution reaches the source location around line 5.” Line numbers naturally change as you edit; function breakpoints are often more durable in a small program.
Manage breakpoints with:
info breakpoints
delete 1
A breakpoint may trigger many times in a loop or frequently called helper. In those cases, do not blindly step from the start each time. First inspect the breakpoint list, then either move the breakpoint closer to the suspected condition or use a condition when you have a relevant variable:
condition 1 value > 100
This tells GDB to stop at breakpoint 1 only when value > 100 is true. Conditional breakpoints are powerful because they narrow a long execution to a state that matters.
A compact workflow for real defects
When a program crashes or produces the wrong result, use this disciplined loop:
- Rebuild with
-g -O0and your warning baseline. - Choose a location where the relevant values should exist: the suspicious function, a branch, or a line before a failing operation.
- Set a breakpoint and
run. - Use
listandframeto confirm exactly where execution paused. - Use
info args,info locals, and targetedprintexpressions to test your assumptions. - Use
backtraceto identify the call chain that produced the state. - Switch to caller frames when the source of a bad argument may lie outside the active function.
- Use
next,step,finish, orcontinueaccording to the control-flow question. - Repair the actual source defect, rebuild, and rerun.
If a program instead crashes before you know where to set a breakpoint, launch it under GDB and let it fail:
gdb ./app
run
backtrace
When GDB stops on a signal such as SIGSEGV, frame #0 identifies the immediate fault location. The caller frames tell you how execution arrived there. This complements the sanitizer workflow from the previous lesson: GDB lets you examine live state, while sanitizers often provide stronger diagnosis for memory-safety and undefined-behavior violations.
Takeaways
- Build debug targets with
-g; use-O0initially to make source-level debugging clearer. - A stack frame represents one active function invocation. GDB’s frame
#0is the currently executing function; higher-numbered frames are its callers. backtracereveals the active call chain, andframe Nchanges the variable-inspection context without changing execution.- Use
info args,info locals, andprintto inspect state at a breakpoint, while remembering that variables not yet initialized do not have meaningful values. - Use
nextto step over calls,stepto enter them,finishto return from the current function, andcontinueto run to the next stopping point.
Next, you will distinguish automatic, dynamic, and static storage duration by tracing object lifetimes in a C++ program. The stack-frame view from this lesson will provide a useful starting point, but object lifetime is a language-level rule that cannot be inferred solely from an address or a frame.
Can't find a good explanation? Sign up and we'll make it for you
Sign up